Postoperative laryngopharyngeal discomfort (POLPD), encompassing symptoms such as sore throat and dysphagia, is a common complication after tracheal extubation, with an incidence of 30–60% [1, 2]. While recognized, research has predominantly focused on critically ill patients, leaving a knowledge gap regarding elective surgical populations [3, 4]. Mechanical pressure from the endotracheal tube is a hypothesized key factor in the development of POLPD [5, 6]; however, current clinical monitoring methods fail to capture this specific mechanism. Cuff pressure monitoring, for instance, measures the pressure exerted by the inner wall of the tracheal tube cuff against the tracheal mucosa to ensure an adequate seal and prevent aspiration. This reflects only the pressure transmitted from the cuff to the tracheal wall and is primarily concerned with tracheal ischemia, not the compressive forces exerted by the outer wall of the tube against the soft tissues of the oropharynx. Similarly, esophageal pressure monitoring, achieved via an esophageal balloon, is used to estimate pleural pressure and calculate transpulmonary pressure to assess lung and chest wall mechanics. It does not quantify the localized mechanical stress caused by an indwelling foreign body (the tracheal tube) on the pharyngeal and laryngeal mucosa. Therefore, a direct, quantitative method for assessing the contact pressure between the tracheal tube and oropharyngeal tissues is critically needed.
Beyond the lack of direct pressure measurement, the risk factors for POLPD in elective surgery populations also remain poorly defined. Factors identified in critical care [7, 8] (e.g., prolonged intubation [9]) may not apply to elective settings. We therefore focused on non-critically ill elective surgery patients. Preliminary observations linked prone positioning to POLPD. We adapted a T-scan occlusal analysis system to quantitatively measure tracheal tube contact pressure.
This pilot study aimed to: (1) explore the relationship between tracheal tube contact pressure and POLPD, and (2) identify simplified clinical risk indicators.
METHODS
This study was conducted in accordance with the Declaration of Helsinki. The study protocol was approved by the Ethics Committee of China-Japan Friendship Hospital (approval number: 2023-KY-219). Written informed consent was obtained from all individual participants included in the study. This study is a pre-specified analysis of a completed prospective observational cohort whose protocol has been published previously [10]. The original study (NCT05987293), conducted at China-Japan Friendship Hospital (October 2023 to May 2024), aimed to evaluate the feasibility of a novel tracheal tube pressure measurement method and broadly explore risk factors for POLPD. Upon completion of enrollment, the present analysis was undertaken to quantitatively investigate the relationship between tracheal tube contact pressure – a key mechanistic variable – and the incidence of POLPD. Following preliminary observations linking prone positioning to elevated pressures, we adopted a case-control approach (POLPD vs. non-POLPD groups) to broadly investigate clinical risks.
Participant enrollment and eligibility criteria
Eighty-nine patients scheduled for elective surgery (≥ 2 hours) under general anesthesia with tracheal intubation were enrolled. Inclusion criteria comprised: (a) American Society of Anesthesiologists (ASA) physical status I–III; (b) age 18–85 years; (c) scheduled for elective surgery requiring tracheal intubation with anticipated duration ≥ 2 hours; (d) provision of written informed consent.
We excluded participants with: (a) lack of documented informed consent; (b) maxillofacial or upper airway surgery; (c) history of head and neck radiotherapy; (d) preexisting oral or lingual abnormalities (deformities, trauma, infection, or active bleeding); (e) airway hyperresponsiveness, active asthma, acute exacerbation of chronic obstructive pulmonary disease, or laryngeal osteomalacia; (f) respiratory insufficiency or moderate-to-severe ventilatory/diffusion dysfunction; (g) chronic sore throat, upper respiratory tract infections, recurrent laryngeal nerve injury, dysarthria, dysphagia, severe gastroesophageal reflux, upper esophageal sphincter dysfunction, or cardiac stenosis; (h) planned postoperative parenteral nutrition therapy.
Perioperative information and follow-ups
Baseline demographics and airway assessment data were collected, including age, sex, height, weight, body mass index (BMI), ASA classification, and expected surgical position.
Airway measurement indices were categorized based on the practical procedures in our medical center and the universally recognized criteria for difficult airway risk factors [11, 12]. Participants with neck circumference ≥ 40 cm, Mallampati grading III or IV, thyromental distance < 6 cm, mandibular ramus < 6 cm, obstructive sleep apnea/hypopnea syndrome (OSA), difficult mask ventilation, or > 2 attempts at intubation were recorded. The intubation devices, approaches, and the type and dimensions of the endotracheal tube were recorded.
The protocol for head and neck positioning was as follows: after induction and intubation in a neutral supine position, patients were moved into the final surgical posture. The cervical occipital angle (O–C2) was then quantified from a lateral X-ray. To ensure reliability, two blinded assessors (MTZ and HNM) independently performed all measurements twice. The mean of the two measurements was used for analysis. The inter-rater reliability was excellent (intraclass correlation coefficient [ICC] = 0.92).
During the surgery, respiratory parameters were recorded during steady state, including minute ventilation volume, peak airway pressure (Ppeak), mean airway pressure (Pmean), and positive end-expiratory pressure (PEEP). Input and output volume (I/O) was calculated as the infusion volume minus urine and blood loss. The duration of tracheal tube maintenance and the duration of surgery were recorded.
The T-scan III system (Tekscan Inc., Boston, MA, USA) was adapted to measure tracheal tube contact pressure. This system uses a thin, flexible sensor sheet containing a grid of sensing elements. Prior to each use, the sensor was calibrated according to the manufacturer’s protocol to ensure measurement accuracy. To further validate its applicability in the moist, curved environment of the oropharynx, we conducted an in vitro study simulating the contact between the tracheal tube and the tongue/palate surface, using a pressure gauge as a reference standard. This study demonstrated excellent agreement between the T-scan-derived relative force and the absolute contact pressure/stress, with high coefficients of determination and concordance correlation coefficients. Accordingly, before this clinical trial, we established working curves to convert the relative force readings to absolute contact pressure and stress, which were applied in the current clinical measurements.
The sensor was positioned to record pressure at the interface between the tube and the surrounding oropharyngeal tissues. To prevent displacement during patient repositioning (e.g., from supine to prone), the sensor was securely attached to the outer wall of the tracheal tube using waterproof medical adhesive tape along its entire length. A reference mark was made on the tube at the level of the incisors using a surgical marker; before each pressure recording, the operator verified that the sensor remained in the correct position by aligning the mark with the incisors and by inspecting the real-time pressure distribution image on the T-scan display, which provides sufficient spatial resolution to detect any shift. In all cases, no displacement was observed throughout the procedure. The pressure, contact area, and contact force on the tracheal tube were read at four time points: T0 (after tracheal intubation), T1 (after patient positioning), T2 (before the end of surgery), and T3 (before extubation). The contact force applied on the tracheal tube was read from the tracheal tube-palate and tracheal tube-tongue sensors of the T-scan system. The pressure distribution onto the tube was estimated as net force divided by contact area, which could be displayed accurately on the sensor.
We followed up participants at 1, 3, and 12 hours after surgery and once a day until 7 days after surgery. Postoperative adverse events in the recovery room were recorded, including hoarseness, dyspnea, significant deterioration of respiratory function, or increased oxygen therapy. As part of routine post-anesthesia care, all participants were encouraged to resume eating 6 h after surgery. The time of the first successful attempt to ingest liquids (tliquid) and solid food (tfood) was recorded. Patient satisfaction was measured on a scale from 1 to 10, where 10 represented the highest level of satisfaction and 1 the lowest.
Outcome measurements
The primary endpoint was POLPD, diagnosed according to any sign meeting the following criteria: (a) severe pharyngalgia, defined as a score of NRS 4 or more, indicating that patients were unable to sleep or rest quietly due to pharyngeal pain; (b) profound dysphagia, defined as a score of ≥ 4 on the bedside water swallow test (WST). This indicated the need for more than two attempts to swallow 30 mL of warm water, accompanied by coughing, or being unable to swallow it at all [13]; (c) prominent tongue edema, defined as a condition where significant enlargement of the tongue was observed, presented as teeth-printed tongue, or the presence of ulcers on the enlarged tongue surface [14]. Prominent tongue edema was assessed clinically and, when feasible, documented with preoperative and postoperative photographs for blinded assessment (see Supplemental File 1).
The secondary outcomes included the time from extubation to the first successful attempt at water intake (tliquid) and solid food intake (tfood), and the lowest self-rating satisfaction score during the follow-up period. Adverse events, including difficult mask ventilation or intubation, soft tissue injury or edema of the head and face, and airway-related events (such as bronchospasm, aspiration, re-intubation, pulmonary infection, ventilation insufficiency, or prolonged oxygen therapy), were recorded.
Binary logistic regression: assessing perioperative risk factors for POLPD
Baseline data and perioperative factors with clinical significance and statistical differences were transformed into categorical variables, and univariate logistic regression analysis was performed. The covariates included age, sex, BMI, surgical position, cervico-occipital angle, thyromental distance, mandibular angle, Mallampati grade, and OSA.
Two composite metrics were included: (a) narrow pharyngeal cavity, defined as any one of the four following signs: BMI ≥ 30 kg m–2, thyromental distance < 6 cm, symptoms of OSA, or Mallampati grade ≥ III; and (b) high-risk surgical position, which is the prone position with O–C2 angle exceeding the neutral range (10–18°). This range was derived from the mean ± 1 SD (14.5 ± 3.7°) reported by Tang et al. [15]. The selection of components for these composites was based on clinical relevance and established associations with difficult airway or pharyngeal crowding. Given that the small sample size may affect the distribution assumptions, the bootstrap method was employed for sampling to enhance the robustness of the results.
Reliability assessment of the model based on cross-validation
A stratified k-fold cross-validation was conducted to verify the model’s reliability. The 89 enrolled cases were stratified to ensure that the ratio of POLPD in each fold was consistent with that of the overall population. Subsequently, the data were randomly divided into five non-overlapping subsets: one was selected as the test set and four were combined as the training set to construct the logistic regression model. This process was repeated five times, and the test results of the model were recorded. Cross-validation was used to test the binary logistic regression models constructed based on clinical risk factors and pressure overload.
Sensitivity analysis
A subgroup analysis was conducted to determine whether the clinical risk model and the pressure overload could significantly influence the occurrence of POLPD in subgroups with different airway devices.
Sample size estimation
Sample size estimation was performed using PASS 2021 software. The initial calculation, based on previously reported incidences of POLPD-related outcomes – 78% for postoperative narrowed laryngopharyngeal space in prone-positioned patients [16] and 33% for dysphagia and sore throat in supine-positioned patients [17] – yielded a target sample size of 54 participants (27 per group).
However, during the early phase of this pilot study, we observed a lower incidence of POLPD in the prone position than anticipated based on the literature. To ensure adequate statistical power to detect clinically meaningful effects and to avoid conducting an underpowered study – a critical ethical and scientific consideration, particularly when introducing a novel measurement technique – the sample size re-calculation was indeed performed prior to data analysis and was approved by our institutional ethics committee, indicated that 89 participants would be required. A post-hoc power analysis using G*Power 3.1 (University of Dusseldorf, Dusseldorf, Germany) confirmed that the final sample of 89 participants provided 96% power (Supplemental File 2) for the pre-specified primary analysis under the binomial test model.
Missing data
No patients were lost to follow-up, and primary outcome data were complete for all participants. Missing data in secondary outcomes were minimal (< 4.5%) and were handled by multiple imputation after Little’s test confirmed they were missing completely at random (P > 0.05).
Statistical analysis
Statistical analyses were conducted using IBM SPSS Statistics (version 27; IBM Corp., Armonk, NY, USA). Continuous variables are summarized as mean ± SD or median [IQR], and categorical variables as n (%). Group differences were assessed using t-tests, Mann-Whitney U tests, or c2 tests. Risk factors for POLPD were identified via binary logis-
tic regression, with results expressed as ORs and 95% CIs. The pressure-overload index was derived from a logistic regression model. Model fit was evaluated with the Hosmer-Lemeshow test, and multicollinearity was checked (VIF < 2). Statistical significance was set at P < 0.05.
The sample size re-estimation was planned and approved during the early phase of the study (see section: Sample size estimation), and the current analysis of the pressure – POLPD relationship was pre-specified in the study protocol (NCT05987293). Post-hoc analyses were prespecified and explicitly declared.
RESULTS
Perioperative information
This prospective observational study followed STROBE guidelines [18] (Supplemental File 3). From October 19, 2023, to May 31, 2024, 89 patients were enrolled; 35 (39.1%) developed POLPD. Table 1 summarizes participant characteristics: mean age 63.0 ± 10.6 years, BMI 25.3 ± 3.2 kg m–2. Surgical procedures included peripheral neurolysis (supine, n = 28), posterior thoracolumbar surgery (neutralprone, n = 51), and posterior cervical spine surgery (flexion-prone, n = 10). Mean surgical duration was 183 ± 74 minutes; intubation and ventilation time was 210 ± 68 minutes.
TABLE 1
Baseline and perioperative information
Airway management was individualized. Intubation methods: direct laryngoscopy (32.5%), video laryngoscopy (64.0%), optical stylet (2.2%), and fiberoptic bronchoscopy (1.1%). Tubes were midline-secured; reinforced tubes were used in 67.4% of cases. Tube sizes: 7.0 mm for females (44.9%), 7.5 mm for males (55.0%). The incidence of POLPD did not differ significantly between patients with reinforced and standard tubes (23/60 [38.3%] vs. 11/29 [37.9%], P = 0.970), suggesting that tube type was not an independent risk factor for postoperative laryngopharyngeal discomfort.
Pre-extubation video laryngoscopy showed no soft tissue injury or tongue edema. Ventilatory settings: flow rate 2.6 ± 0.7 L min–1, Vt 6.4 ± 0.3 mL kg–1, Ppeak 18.7 ± 3.9 cmH2O, Pmean 9.7 ± 3.2 cmH2O, PEEP 3.4 ± 1.4 cmH2O. No head/facial edema occurred; all patients extubated within 15 minutes without adverse events. Net fluid balance: 747 ± 485 mL. Glucocorticoids given for antiemesis or spinal edema; mean methylprednisolone equivalent 71.0 mg (IQR 141.2 mg).
Outcome measurements
POLPD occurred in 35 patients (39.1%). The POLPD group had more females, higher BMI, and non-supine positions (Table 1). They had delayed first liquid intake (P < 0.001) and solid food intake (P < 0.001), and lower satisfaction scores (P < 0.001). No respiratory insufficiency, long-term oxygen therapy, or parenteral nutrition was needed. No major complications occurred.
Binary logistic regression analysis of clinical risk factors
Univariate analysis of POLPD risk factors is presented in Supplemental File 4. Multivariate binary logistic regression used three variables: female sex, prone-flexion/extension position, and narrow pharyngeal cavity. Two models were built (Table 2). Model 1 had poor fit (Hosmer-Lemeshow c2 = 26.597, P < 0.001). As an exploratory step not pre-specified in the original protocol, we tested an interaction term between female sex and narrow pharyngeal cavity based on anatomical considerations [19, 20]. The resulting Model 2, which should be interpreted as exploratory, showed acceptable calibration (c2 = 0.847, P = 0.655). Multicollinearity was absent: VIFs for female sex, position, and narrow pharynx were 1.026, 1.151, and 1.177 (tolerances > 0.85); condition index 3.551; eigenvalue 0.233. For clinical use, we created a mnemonic: “lady overweight, chin short, snore, airway tight” (female with narrow pharynx) and “neck bent too far” (prone position with non-physiological O–C2 angle). In this mnemonic, “overweight” refers to BMI ≥ 30 kg m–2, “chin short” corresponds to thyromental distance < 6 cm, “snore” indicates a history or symptoms of OSA, and “airway tight” reflects Mallampati grade ≥ III – all of which are the components used to define “narrow pharyngeal cavity” in our multivariate analysis (see section: Binary logistic regression: assessing perioperative risk factors for POLPD). Given that the interaction term in Model 2 was not pre-specified, these findings should be regarded as hypothesisgenerating and require independent validation.
TABLE 2
Multivariate regression analysis
Pressure overload as a quantitative risk factor of POLPD
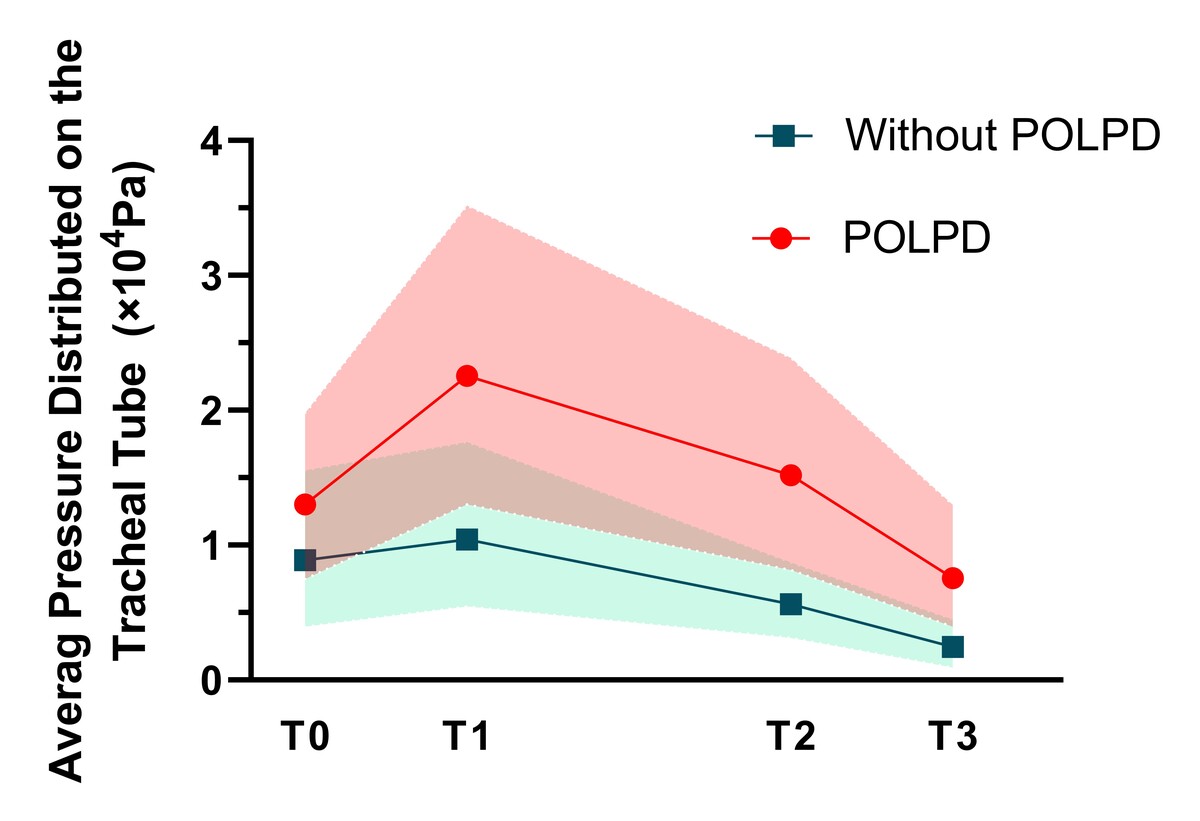
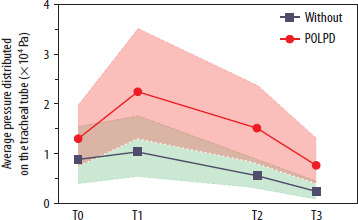
Figure 1 shows tracheal tube pressure distribution over time (T0–T3). We defined a pressure overload index, Π(P), as the product of mean pressure and time at each phase:
FIGURE 1
Tracheal tube contact pressure over time in patients with and without postoperative laryngopharyngeal discomfort (POLPD). Pressure was measured at discrete sensor loci using an adapted T-scan III system. Data points represent mean pressure, and the light-colored bands indicate the 95% confidence intervals. The POLPD group consistently demonstrated higher average pressures throughout the intraoperative period, supporting the association between mechanical stress and symptom development
POLPD – postoperative laryngopharyngeal discomfort, T0 – after tracheal intubation, T1 – after patient positioning to meet the requirements of the surgical operation, T2 – before the end of surgery (surgical position maintained), T3 – before extubation
Π(Pi) = Pi × ti
Pressure overload index = f(Pt) = –2.677 + 0.032 Pressure0t0 + 0.03
Pressure1t1 + 0.02 Pressure2t2 + 0.048 Pressure3t3
Logistic regression using these integrals showed moderate fit (R2 = 0.303). Model 3: pressure overload index predicted POLPD (OR = 1.174, 95% CI: 1.006– 1.370, P = 0.041; Table 2). Model fit was acceptable (Hosmer-Lemeshow c2 = 12.680, P = 0.123). No multicollinearity: VIFs for the Π(P) variables were 1.000, 1.402, 3.597, and 3.040 (tolerance values: 1.000, 0.713, 0.278, 0.329; all > 0.1); condition index 1.558; eigenvalue 0.584. The pressure-overload index, derived from the product of pressure and time across four intraoperative phases, was significantly associated with POLPD, and this association remained stable upon five-fold cross-validation. These findings suggest that cumulative mechanical stress may contribute to the pathogenesis of POLPD.
Reliability assessment of the model based on cross-validation
Five-fold cross-validation (Tables 3 and 4) showed good model stability and fit.
TABLE 3
Cross-validation for clinical risk factor model
[i] *P < 0.05.
Note: The interaction term in the clinical risk factor model was not pre-specified; see section Binary logistic regression analysis of clinical risk factors.
a“Narrow pharyngeal cavity,” defined as any one of the three following signs: BMI ≥ 30 kg m–2, thyromental distance < 6 cm, symptoms of OSA, or Mallampati grade ≥ III.
b“High-risk surgical position,” defined as prone position with O–C2 angle exceeding the neutral range of 10–18°.
TABLE 4
Cross-validation for pressure overload model
Sensitivity analysis
Sensitivity analysis by the intubation method (Table 5): The video laryngoscope group (n = 57) had increased POLPD risk with anthropometry-related factors (OR 2.6, 95% CI: 1.328–5.090, P = 0.005), position-related factor (OR 5.160, 95% CI: 2.445–10.890, P < 0.001), and pressure overload (OR 16.594, 95% CI: 6.882–40.013, P < 0.001). Alternative devices group (n = 32) also showed significant risks: anthropometry (OR 3.834, 95% CI: 2.321–6.336, P < 0.001), position (OR 2.290, 95% CI: 1.449–3.620, P < 0.001), pressure overload (OR 6.286, 95% CI: 3.679–10.741, P < 0.001).
TABLE 5
Subgroup study
DISCUSSION
This pilot study demonstrates the feasibility of measuring tracheal tube contact pressure using an adapted T-scan system and identifies simplified clinical risk profiles for POLPD. As an exploratory investigation, our primary aim was hypothesis generation rather than establishing definitive predictive models – a deliberate approach given the novel measurement methodology.
The most significant finding is the first quantitative evidence linking increased tracheal tube contact pressure to POLPD. The pressure overload index (OR = 1.174) should be interpreted in context: the T-scan sensor captures pressure from discrete loci rather than providing continuous circumferential measurement. Therefore, this index serves as a proxy for overall mechanical stress, likely representing an underestimation. While not yet ready for clinical application, this finding validates the pathophysiological concept and establishes real-time pressure monitoring as a promising research direction.
Regarding clinical risk indicators, our findings identify two key profiles: the “at-risk airway” (female with narrow pharyngeal cavity) and the “at-risk position” (prone with non-physiological O–C2 angle). The observation that all POLPD cases occurred in prone-positioned patients underscores positioning as a primary, modifiable risk factor. While anthropometric factors are fixed, the intraoperative cervicooccipital angle can be actively controlled. Our data suggest that maintaining a neutral O–C2 angle during prone spine surgery could mitigate POLPD risk.
METHODOLOGICAL CONSIDERATIONS AND CLINICAL IMPLICATIONS
We defined POLPD as a composite endpoint to capture its multifaceted nature, justified in this early-phase investigation. Composite variables enhanced statistical power while avoiding overfitting. Our focus on elective, non-critically ill patients isolated anatomy and positioning contributions from confounding inflammatory factors prevalent in ICU populations.
The 39.1% POLPD incidence following elective surgery with > 2 hours intubation underscores its clinical significance. Our findings identify: (1) female patients with “narrow pharyngeal cavity” characteristics had a 3.26-fold increased odds of POLPD in an exploratory interaction model (Model 2), suggesting potential synergistic anatomical effects that require prospective confirmation; (2) the prone position with O–C2 angles outside the neutral range (10–18°) was associated with a 1.94-fold increased risk. The pressure overload index showed a doseresponse relationship, supporting cumulative mechanical stress in POLPD pathogenesis.
Our findings align with previous literature. Female sex is a recognized risk factor for post-intubation complications [21]. Anatomical studies confirm that female pharyngeal cavities are 10–30% smaller [19, 20], with increased device injury susceptibility [22]. Females exhibit higher upper airway resistance and fat distribution, exacerbating pharyngeal narrowing [22, 23]. The prone position’s effect on pharyngeal hydrostatic pressure [24, 25], combined with venous return compromise during neck hyperflexion/extension [15, 26], creates conditions favorable for POLPD development. O–C2 angle reduction directly correlates with oropharyngeal space diminution [27, 28], supporting our positional findings.
While the O–C2 angle measurement in this study was obtained from lateral X-rays – a method justified by the need to precisely document the surgical positioning, particularly for patients undergoing posterior cervical spine surgery, where such imaging is part of routine care – we acknowledge that this requirement may limit the bedside applicability of this risk indicator in everyday anesthetic practice. In our cohort, X-rays were also obtained for some patients who would not normally require them, solely for research purposes. Therefore, although the quantitative O–C2 angle is a strong predictor of POLPD, its reliance on radiography makes it less accessible to anesthesiologists at the bedside. To bridge this gap, future research should explore simple clinical surrogates that can estimate extreme neck positions without imaging. For instance, measurements such as the distance between the chin and the sternum, or the angle of the neck relative to the torso, might serve as practical proxies for detecting non-physiological O–C2 angles. Even in the absence of precise quantification, the key message for clinicians is to avoid excessive flexion or extension of the head and neck during prone positioning, as our data suggest that maintaining a neutral alignment may reduce POLPD risk. Thus, while the O–C2 angle itself may not be directly measurable in all settings, the concept of avoiding extreme neck positions remains a valuable and easily implementable precaution.
LIMITATIONS AND FUTURE DIRECTIONS
This study has limitations that should be considered when interpreting its findings. First, while the composite endpoint for POLPD enhances clinical relevance, it may introduce reporting bias due to the condition’s heterogeneous presentations. Second, the single-center design and sample size, though carefully determined to ensure methodological feasibility and patient safety in this novel investigation, limit the generalizability of our results. Third, the intermittent fluoroscopic measurement of O–C2 angles may have missed dynamic positional changes during surgery. Most importantly, the adapted T-scan system, while innovative, captures pressure from discrete sensor areas rather than providing circumferential measurement of the entire tube-tissue interface. This methodological characteristic explains both the modest effect size of the pressure overload index and why this study appropriately establishes an association rather than definitive predictive thresholds. Furthermore, the sex-by-narrow-pharynx interaction term in Model 2 was introduced as a post-hoc exploratory analysis after Model 1 failed calibration and was not pre-specified in the study protocol; therefore, these findings should be interpreted with caution and require replication in an independent sample. Future research should focus on developing dedicated endotracheal pressure monitoring systems, implementing continuous cervical angle assessment, and validating these findings in larger, multicenter cohorts. Once such real-time monitoring becomes available, anesthesiologists could respond to highpressure readings by taking corrective actions, such as adjusting the patient’s head position to relieve focal pressure or considering alternative airway devices. These interventions, guided by real-time feedback, may help prevent the development of POLPD and enhance airway protection.
CONCLUSIONS
This study provides quantitative evidence linking tracheal tube contact pressure to POLPD. Two principal risk profiles were identified: females with a narrow pharyngeal cavity and patients in a prone position with a non-physiological O–C2 angle. A derived pressure-overload index demonstrated a significant dose-response relationship with POLPD. The study’s principal contributions lie in its innovative pressure monitoring methodology and the identification of readily assessable clinical risk factors, establishing a foundation for targeted airway protection strategies.