
Recent studies have expanded our understanding of the cardiovascular implications of intra- abdominal hypertension (IAH) and abdominal compartment syndrome (ACS). Elevated intra-abdominal pressure (IAP) can significantly impact cardiovascular function by reducing venous return, thereby decreasing cardiac preload and output [1]. This reduction in preload is primarily due to the compression of the inferior vena cava, leading to diminished venous return to the heart.
Monitoring techniques have also evolved. While traditional methods focus on barometric filling pressures, recent guidelines emphasise the importance of measuring abdominal perfusion pressure (APP), calculated as mean arterial pressure (MAP) minus IAP [2]. Maintaining an APP above 60 mmHg is associated with improved outcomes in patients with IAH [3, 4]. Other suggested perfusion indices are mean perfusion pressure (MPP), calculated as MAP minus central venous pressure (CVP) [5, 6] and effective renal perfusion pressure (eRPP), calculated as: eRPP = MAP – (IAP + CVP + mean alveolar pressure) [7].
The Abdominal Compartment Society (formerly known as the World Society of the Abdominal Compartment Syndrome, WSACS, www.wsacs.org) is planning to release updated guidelines, highlighting the significance of early recognition and management of IAH/ACS to prevent multiorgan failure. Previous guidelines recommend regular IAP monitoring in high-risk patients and a structured approach to treatment, including both medical and surgical interventions when necessary [8].
In terms of treatment strategies, a multifaceted approach is advocated. This includes strategies to improve abdominal wall compliance, reduce intraluminal and intra-abdominal (fluid) contents and optimising fluid management to avoid volume accumulation, using early vasoactive medications to support APP, and considering surgical decompression in refractory cases [8]. Early intervention is crucial to prevent the progression of organ dysfunction associated with elevated IAP. This framework can be extrapolated to different types of patients and has been recently developed to prevent acute kidney injury in patients undergoing cardiac surgery [2].
Recent clinical trials and systematic reviews have reinforced the importance of individualised resuscitation endpoints [9]. Tailoring treatment to maintain adequate organ perfusion while minimising the risks associated with elevated IAP is essential. This personalised approach helps in achieving better patient outcomes by balancing the need for fluid resuscitation with the risk of exacerbating IAH [2].
In summary, advancements in understanding the cardiovascular effects of IAH/ACS, coupled with updated monitoring techniques and treatment guidelines, have enhanced the management of these conditions. Early recognition and a comprehensive, individualised treatment approach are paramount in improving patient outcomes.
MULTIPLE ORGAN DYSFUNCTION SYNDROME HAS BEEN DESCRIBED AS THE COMMON FINAL PATHWAY
The role of elevated IAP and its systemic effects was first described over 100 years ago. Interest in this topic was revived in the 1970s and 1980s, partly due to observations related to laparoscopic surgery and the increased intra-abdominal pressures resulting from peritoneal insufflation [10]. It is now acknowledged as a potentially hidden cause of increased morbidity and mortality in patients with primary intra-abdominal conditions or injuries, or as a secondary complication arising from pathophysio-logical abnormalities or their management in other conditions, such as burns and severe sepsis [11–13]. Recent reviews found that the incidence of IAH after cardiac surgery ranges between 27–83% [14–16].
In 2007 [17], with an update in 2013 [8], the Abdominal Compartment Society published standardized guidelines on measuring IAP and defining normal and abnormal pressure ranges. In critically ill patients, IAP can be measured using an indwelling Foley catheter with a three-way stopcock [18, 19]. Measurements should be performed with the patient in the supine position, ensuring relaxed abdominal musculature, and the transducer levelled where the mid-axillar line crosses the iliac crest. After instilling a maximum of 20–25 mL of sterile saline into the bladder, readings are taken at end- expiration. Normal IAP is considered to be 5–7 mmHg and pathophysiological changes are seen when it exceeds 12 mmHg [20]. However, new automated methods for measurements were proposed, which allow for regular measurement without requiring additional device manipulation [21].
IAH is classified as follows:
ACS is defined as Grade 3 IAH accompanied by new-onset organ dysfunction caused by a combination of backward and forward failure. Additionally, ACS and IAH can be classified as primary or secondary, depending on whether the underlying disease or injury originates within the abdominal-pelvic region [22].
PATHOPHYSIOLOGY OF CARDIOVASCULAR IMPLICATIONS OF IAH
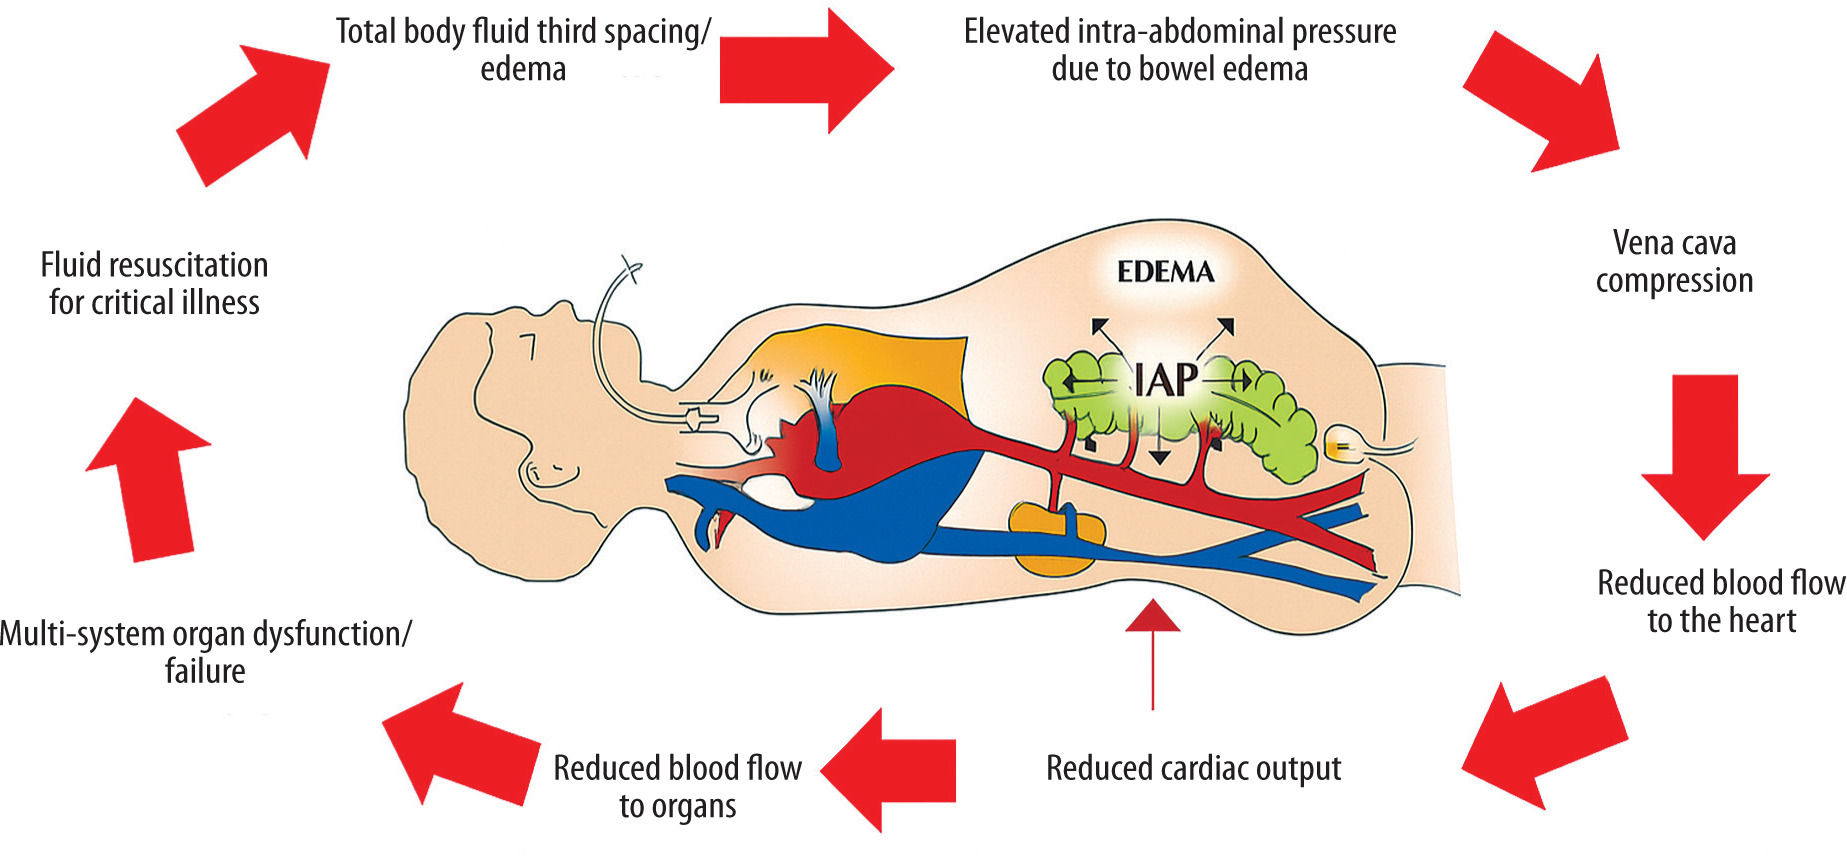
The primary cause of secondary IAH and ACS is mainly iatrogenic, resulting from excessive fluid resuscitation with crystalloid solutions (especially 0.9% NaCl), especially when IAP monitoring is inadequate (Figure 1) [23, 24]. The abdominal compartment functions as a complex, closed system interconnected with intrathoracic pressure (ITP) through diaphragmatic positioning and the compliance of the abdominal wall, which depends on its elasticity and ability to expand [12, 20, 25].
The more rigid and noncompliant components of this compartment include the pelvic girdle, pelvic floor, vertebral column, paravertebral muscles, and associated structures [25]. In critically ill patients, second and third spacing – where intravascular fluid leaks into interstitial or nonvascular compartments – is common [26]. Fluid may accumulate in the subcutaneous tissues of the abdominal wall, abdominal organs such as the intestines or mesentery, the peritoneal cavity, and even other cavities such as the pleural space. Excessive fluid accumulation can increase the volume of structures within the abdominal cavity, reduce the elasticity and compliance of the abdominal wall, and cause upward displacement of the diaphragm. As intra-abdominal volume increases, reshaping and finally pressurisation of the abdominal cavity occur and the system’s overall compliance decreases, leading to a steep rise in IAP that may occur at lower relative volumes [27].
This complex relationship between the abdominal cavity, abdominal wall, and thoracic cavity can be further affected by underlying chronic conditions such as chronic obstructive pulmonary disease and integumentary diseases (e.g. progressive systemic sclerosis), or acute injuries, such as eschar formation and tissue oedema from truncal burns [28]. However, the exact nature of volume-pressure curves for the abdominal cavity and their relationship with intravenous fluid resuscitation remains unknown.
FIGURE 1
Vicious cycle illustrating how ongoing intravenous fluid resuscitation can cause iatrogenic secondary intra-abdominal hyper-tension and multiple organ failure. Adapted with permission from Malbrain MLNG et al. according to the Open Access CC BY Licence 4.0 [23]
A primary haemodynamic effect of IAH and ACS is a reduction in cardiac output (CO), which may lead to inadequate perfusion and subsequent ischaemia of vital organs. However, the threshold of IAP at which cardiovascular function becomes compromised varies among individuals. In some patients, even modest elevations in IAP (e.g., ~10 mmHg) can impair cardiac performance, while others may maintain stable MAP and cardiac output despite significantly elevated IAP levels. Mullens and colleagues [29] found that slight increases in IAP as small as 8 mmHg were related to worsening renal function in patients with acute decompensated heart failure. This led to the recognition of the cardio-abdominal-renal syndrome (CARS) [30].
The mechanism behind reduced CO in IAH is multifactorial. A key contributor is the upward displacement of the diaphragm, which raises ITP and impairs venous return to the right atrium. This reduction in preload ultimately decreases stroke volume and CO [31–33]. Patients with reduced circulating volume and those on mechanical ventilation with positive end-expiratory pressure (PEEP) are particularly vulnerable, as even minor increases in IAP can significantly compromise venous return and cardiac function [34–36].
Additionally, anatomical distortion of the diaphragm may lead to compression at the level of the diaphragmatic foramen, where the inferior vena cava (IVC) passes, further obstructing venous return [37]. Elevated ITP also compresses the pulmonary parenchyma and vasculature, increasing pulmonary vascular resistance (PVR) [38]. This may further compromise left ventricular (LV) function due to the principle of ventricular interdependence – right ventricular (RV) dilation, and dysfunction can cause septal shift, reducing LV end-diastolic volume and impairing output.
Moreover, increased ITP can directly decrease cardiac compliance, limiting ventricular filling and mimicking a tamponade-like state. This stiffening of the cardiac chambers restricts end-diastolic volume and further reduces output.
Systemic vascular resistance (SVR) is also affected in complex ways. Vasoconstriction may occur as a compensatory response to falling CO or as a side effect of vasoactive agents. Additionally, third spacing from fluid resuscitation can lead to tissue oedema, further compressing the microvascular beds and exacerbating resistance and impairing tissue perfusion. While patients with preserved cardiac function may have sufficient physiological reserve to compensate for these changes, those with pre-existing cardiac disease or hypovolaemia may exhibit more pronounced haemodynamic deterioration.
Importantly, the consequences of IAH extend beyond direct cardiovascular compromise [39]. Blood flow to other organs is often significantly reduced in patients with ACS, and these ischaemic changes may influence the distribution and clearance of inflammatory mediators [40]. For example, mesenteric arterial flow may be diminished, and venous pressures increased [41, 42], leading to intestinal oedema, ischaemia, and loss of gut barrier integrity [43]. These alterations may facilitate bacterial translocation and the systemic spread of intraluminal toxins [44–46]. Similarly, hepatic blood flow can be impaired, disrupting microcirculation and causing ischaemic liver injury [47, 48]. Hepatic dysfunction may impair metabolic processes, including clearance of lactate and other mediators absorbed from the gut [49]. Renal function is also commonly affected, with reductions in renal arterial inflow, elevations in venous pressure, and shunting away from the renal cortex – all contributing to a decreased glomerular filtration rate [50]. A recent systematic review showed that patients with IAH have 2.57-fold higher risk of AKI compared to patients without IAH [51]. Impairment of hepatic and renal function may further alter the balance of circulating inflammatory mediators, perpetuating systemic haemodynamic instability. Together, these changes illustrate the profound and widespread impact of IAH and ACS on cardiovascular and organ function, underscoring the need for early recognition and intervention.
Cardiovascular dysfunction and failure and haemodynamic instability are commonly encountered in patients with IAH or ACS. The various effects are listed in Table 1 [23].
HAEMODYNAMIC ASSESSMENT AND CLINICAL MANAGEMENT
Managing haemodynamics in the setting of IAH and ACS can be particularly challenging. Importantly, the risk of organ ischaemia should not be evaluated solely on the basis of absolute IAP values, but rather in conjunction with APP, calculated as MAP minus IAP (APP = MAP − IAP). A low APP, particularly in cases of elevated IAP combined with hypotension, is more likely to result in compromised organ perfusion and tissue ischaemia. Therefore, in the context of raised IAP, one of the key therapeutic goals is to maintain or elevate MAP with early vasopressors in order to preserve adequate APP. Traditional intravascular pressure monitoring methods – such as CVP or pulmonary artery catheterisation – may be unreliable and potentially misleading in patients with elevated IAP. Studies have shown a poor correlation between pulmonary artery occlusion pressure (PAOP or wedge pressure) and actual LV preload or CO [53, 54]. As a result, alternative approaches to haemodynamic assessment should be considered. This gave rise to the concept of the polycompartment syndrome where increased compartmental pressure affects other compartments [55–57].
Echocardiography, particularly transthoracic echocardiography (TTE), has emerged as a valuable, non-invasive tool for real-time evaluation of cardiac function in critically ill patients with ACS [58]. It enables assessment of IVC diameter and collapsibility, biventricular size and function, septal motion abnormalities, ventricular interdependence, and non-invasive estimates of cardiac output. A subcostal view can assess IVC diameter, and significant respiratory variation may indicate reduced venous return. Notably, complete IVC collapse suggests that IAP exceeds right atrial pressure. Assessment of systemic venous congestion could be performed by ultrasound assessment of hepatic, portal and renal venous flow [59–61]. Echocardiography can be used serially to monitor fluid responsiveness, preload status, and therapeutic response, making it a cornerstone of dynamic haemodynamic assessment in ACS.
Maintaining adequate intravascular volume remains essential in managing critically ill patients. However, there is currently no definitive guidance on the volume of crystalloid resuscitation that may increase the risk of IAH. Inadequate volume resuscitation can exacerbate the effects of mildly elevated IAP, while excessive resuscitation – particularly with crystalloids, 0.9% NaCl – has also been associated with adverse outcomes, including increased mortality [53, 62]. Emerging evidence suggests that excessive fluid administration may directly contribute to raised IAP and the development of ACS [62]. Thus, fluid resuscitation and the use of vasopressors should be tailored and guided by a combination of clinical judgement, haemodynamic monitoring, biochemical markers, and diagnostic imaging. Continuous monitoring of IAP is crucial, particularly in patients undergoing aggressive fluid therapy or those exhibiting signs of worsening organ dysfunction [8].
Optimal haemodynamic management of ACS is based on several foundational principles: a) clinical awareness of the potential for elevated IAP is essential, b) routine IAP monitoring should be performed in patients at high risk of developing IAH, c) preventive strategies, including judicious fluid administration and avoidance of indiscriminate crystalloid (saline) use, should be implemented, d) volumetric assessment of haemodynamics should guide resuscitation decisions rather than relying solely on pressure-based metrics, e) integrated management, considering all aspects of IAH, should be adopted. This includes gastrointestinal decompression, intraperitoneal drainage, ventilator optimisation, fluid removal via diuretics or renal replacement therapy, and, when necessary, surgical decompression with temporary abdominal closure. Of note, although previous case reports described IAH in patients who received non-invasive ventilation (NIV), in a recent study the use of NIV was not associated with an increased incidence of IAH after 24 hours of NIV use [63]. Therefore, IAH should not be considered a contraindication for NIV if it is required [64].
TABLE 1
Cardiovascular effects related to increased IAP* [23]. Adapted with permission from Malbrain et al. according to the Open Access CC BY Licence 4.0
| Cardiovascular effects | |
|---|---|
| 1. Preload (filling) ↓* | |
| Intrathoracic milieu | |
| Diaphragm elevation → cardiac compression | |
| Pleural and intrathoracic pressure ↑ | |
| Pressures used to estimate preload ↑ | |
| Pulmonary-artery occlusion pressure (PAOP) ↑ | |
| Central venous pressure (CVP) ↑ | |
| Mean systemic filling pressure ↑ | |
| Transmural filling pressure →/↓ (pressure outside the heart rises with ITP) | |
| Difficult bedside (barometric) preload assessment (static “filling” pressures unreliable) | |
| True volumetric indices ↓ | |
| Intra-thoracic blood volume index (ITBVI) →/↓ | |
| Global end-diastolic volume index (GEDVI) →/↓ | |
| RV end-diastolic volume index (RVEDVI) →/↓ | |
| Left ventricular end diastolic area index (LVEDAI) →/↓ | |
| Dynamic/functional indices ↑ | |
| Stroke-volume variation (SVV) ↑ | |
| Pulse-pressure variation (PPV) ↑ | |
| Systolic-pressure variation (SPV) ↑ (Δdown →, Δup ↑) | |
| False-negative passive-leg-raising test more common | |
| Fluid-responsiveness thresholds ↑ | |
| Venous return ↓ | |
| Inferior vena cava flow ↓ | |
| Venous return ↓ | |
| Abdominal West zone excursions from zone 1 to zone 3 (Figure 5) | |
| Net effect: preload is actually reduced, despite higher static filling pressures, because the pressure surrounding the heart/lungs is also elevated and venous return is impeded. | |
| 2. Afterload ↑* | |
| Systemic vascular resistance (SVR) ↑ | |
| Mean arterial pressure (MAP) →/↓ (depends on volume status and compensatory tone) | |
| Pulmonary artery pressure (PAP) ↑ | |
| Pulmonary vascular resistance (PVR) ↑ | |
| Raised abdominal- and intra-thoracic pressures compress arterial beds and subsequently increase sympathetic tone, driving SVR and PVR up. | |
| 3. Contractility/Cardiac performance ↓* | |
| LV compliance and intrinsic contractility ↓ Frank–Starling curve shifts downward/rightward | |
| Right, global and left-ventricular ejection fractions →/↓ | |
| Heart rate →/↓ (often blunted by vagal tone or relative hypovolaemia) | |
| Stroke volume ↓ | |
| Cardiac output ↓ | |
| dPmax ↓ | |
| The heart operates on a stiffer pressure–volume curve and at a lower output for any given filling pressure. | |
| 4. Thrombo-embolic and venous sequelae ↑ | |
| Hydrostatic venous pressure in lower limbs ↑ | |
| Venous stasis, oedema and venous ulcers ↑ | |
| Venous thrombosis risk ↑ | |
| Pulmonary embolism risk ↑ (especially on rapid decompression) | |
| Poor wound healing | |
| 5. Other haemodynamic/oxygenation consequences | |
| Abdominal perfusion pressure, APP = MAP – IAP ↓ | |
| Mean perfusion pressure, MPP = MAP – CVP ↓ | |
| Effective renal perfusion pressure, eRPP = MAP – IAP – CVP (– mean Palv, if mechanically ventilated) ↓ | |
| Extra-vascular lung water (EVLW) ↑ (despite compression of the pulmonary micro-vasculature) | |
| Pulmonary vascular permeability index (PVPI) ↑ | |
| Atelectasis and shunt ↑ | |
| Mixed and central-venous O2 saturation ↓ | |
| pO2 ↓ | |
| pCO2 ↑ | |
| Lactate ↑ | |
| *Cardiovascular effects are exacerbated in case of hypovolaemia, haemorrhage, ischaemia, auto-PEEP or high PEEP ventilation. | |
A comprehensive, multidisciplinary approach that incorporates accurate haemodynamic assessment and proactive IAP monitoring is vital to improving outcomes in patients with ACS.
Cardiac function can be broadly characterised by three fundamental components: preload, contractility, and afterload. Elevated IAP adversely affects each of these interconnected elements, as outlined below (see also Table 1) [65].
EFFECT OF IAH ON CARDIAC PRELOAD
Pathophysiology
Elevated IAP exerts multiple detrimental effects on cardiovascular physiology, primarily through direct vascular compression and upward displacement of the diaphragm. Compression of the IVC impairs venous return from the lower body, while diaphragmatic elevation increases ITP and results in cardiac compression (Figure 2). These changes collectively disrupt preload, compromise CO, and complicate haemodynamic assessment.
One of the key challenges in patients with IAH or ACS is the difficulty in accurately assessing pre-load. Standard barometric filling pressures, such as CVP and PAOP, are zeroed against atmospheric pressure. However, in the setting of IAH, elevated ITP – caused by upward displacement of the diaphragm – elevates these pressures, limiting their reliability as true indicators of ventricular preload [23, 66].
As originally described by Coombs [67], increased ITP from diaphragmatic elevation is directly transmitted to intravascular compartments. This not only raises measured CVP and PAOP values but also significantly impairs blood flow through the IVC, thereby reducing venous return in a pressure-|dependent manner [68, 69]. This leads to a corresponding increase in IVC, hepatic, portal vein and femoral vein pressures, parallel to elevations in IAP, and some studies have proposed that IVC pressure may serve as a surrogate marker for IAP itself [70]. Furthermore, as IAP rises, the diaphragm compresses and narrows the IVC at its passage through the diaphragmatic hiatus, further impeding venous return. Notably, such IVC compression may occur at IAP levels as low as 10 mmHg [71]. The resultant decrease in venous return leads to a reduction in stroke volume and, consequently, cardiac output. This decline may be reflected in reduced mixed venous oxygen saturation (SvO2) and central venous oxygen saturation (ScvO2). However, significant elevations of IAP in patients with abdominal ACS could even dampen flow in the hepatic and portal veins due to venous compression [72].
Similar physiological changes have been observed during laparoscopic surgery, where transient increases in IAP lead to comparable haemodynamic alterations. Importantly, in the context of IAH, these changes also heighten the risk of deep vein thrombosis and pulmonary embolism, particularly during or after abdominal decompression [73, 74].
In cases of chronic IAH, such as in obesity, sustained venous congestion may elevate hydrostatic pressures in the lower extremities. Clinical manifestations may include venous stasis, peripheral oedema, and, in severe cases, venous ulcers.
FIGURE 2
Cardiovascular effects (on preload, afterload and contractility) related to increased intra-abdominal pressure
APP – abdominal perfusion pressure, CVP – central venous pressure, DVT – deep venous thrombosis, EDV – end-diastolic volume, EEO – end expiratory occlusion, FC – fluid challenge, IAP – intra-abdominal pressure, ITP – intrathoracic pressure, IVC – inferior vena cava, LV – left ventricular, MAP – mean arterial pressure, PAOP – pulmonary artery occlusion pressure, PE – pulmonary embolism, PLR – passive leg raising, PPV – pulse pressure variation, RV – right ventricular, SVV – stroke volume variation, TPP – transpulmonary pressure
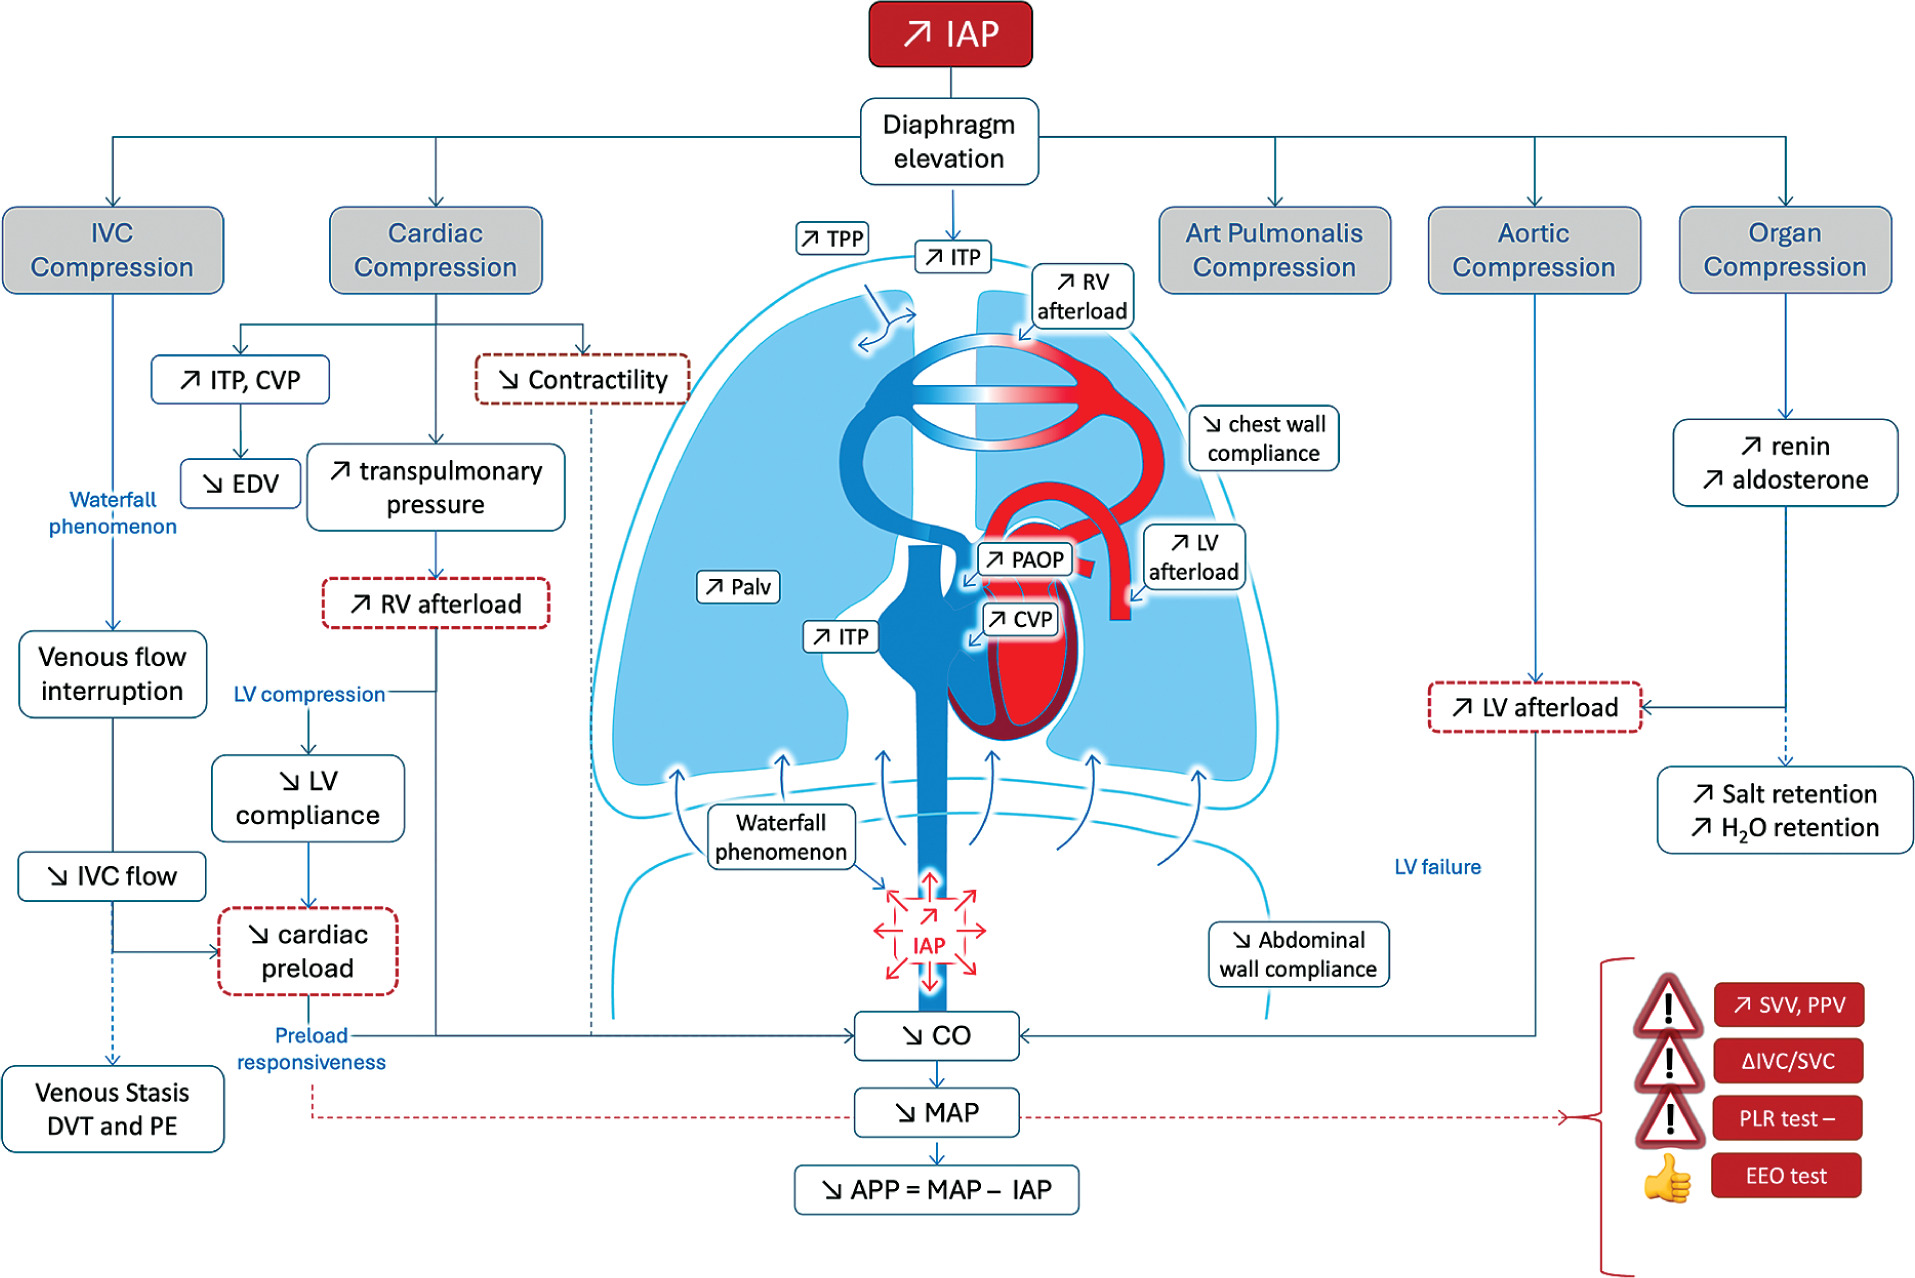
FIGURE 3
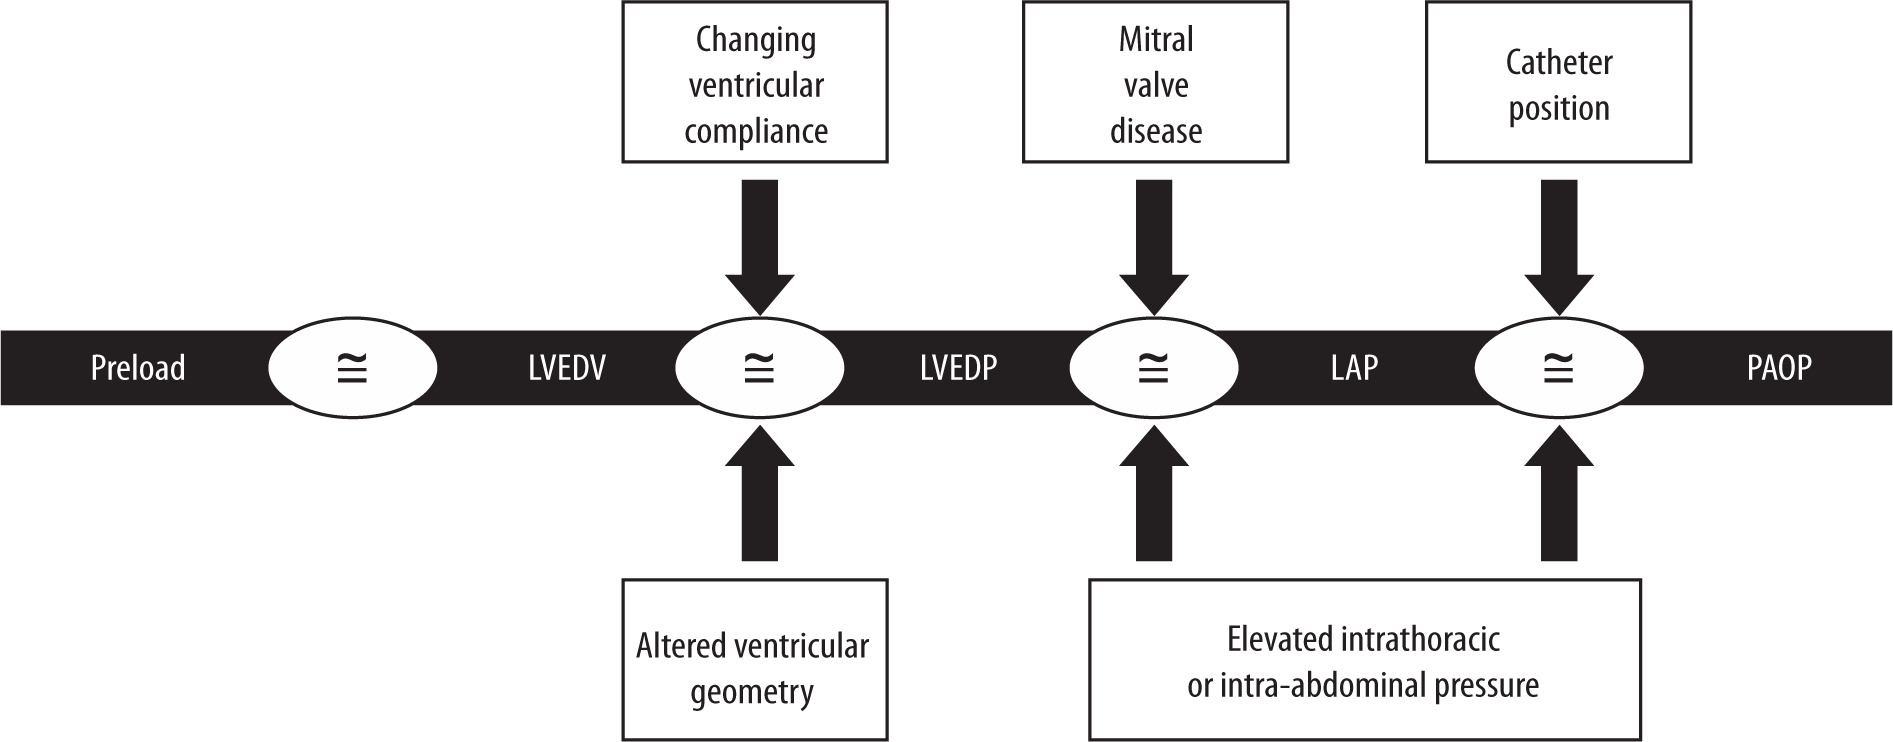
“The PAOP Assumption”: why intracardiac filling pressures such as pulmonary artery occlusion pressure do not accurately estimate preload status. First, ventricular compliance is constantly changing in critically ill patients, resulting in a variable relationship between pressure and volume. As a result, changes in intracardiac pressure no longer directly reflect changes in intravascular volume. The presence of intra-abdominal hypertension (IAH) decreases left ventricular compliance by causing a rightward shift and flattening of the Frank-Starling curve. Second, the elevated intrathoracic pressure associated with IAH has been shown to increase pulmonary artery occlusion pressure (PAOP) and central venous pressure (CVP) measurements by an unpredictable amount, further compromising their reliability. This apparent deviation from Starling’s Law of the Heart arises because both PAOP and CVP are measured relative to atmospheric pressure but actually reflect the sum of intravascular and intrapleural pressures. Third, mitral valve disease can further confound the use of PAOP as an estimate of intravascular volume. Patients with IAH-induced pulmonary hypertension or acute lung injury often have elevated pulmonary vascular resistance and are at significant risk for mitral valve regurgitation. Fourth, accurate PAOP measurements depend on correct placement of the pulmonary artery catheter (PAC). Elevated intra-abdominal pressure can compress the pulmonary parenchyma, altering the normal patterns of alveolar distention and pulmonary capillary pressures as described in West’s lung zones 1, 2, and 3. IAH-induced cardiac and pulmonary dysfunction can distort pulmonary artery waveforms, making correct PAC tip placement in West’s zone 3 challenging. Inadvertent placement in apical zone 1 often leads to PAOP measurements that reflect alveolar rather than left atrial pressure. Adapted with permission from Malbrain MLNG et al. according to the Open Access CC BY Licence 4.0 [23]. LVEDV – left ventricular end-diastolic volume, LVEDP – left ventricular end-diastolic pressure, LAP – left atrial pressure
Intracardiac filling pressures are unreliable during IAH
According to the Frank-Starling principle, ventricular preload is defined as the length of myocar-dial muscle fibres at end-diastole (Figure 3) [23]. In clinical practice, the ideal surrogate for this would be the LV end-diastolic volume (LVEDV); however, this parameter is difficult to measure reliably and repeatedly at the bedside [53, 66]. Assuming that ventricular compliance remains unchanged, variations in ventricular volume would theoretically correspond to changes in ventricular pressure through the following relationships:
Compliance = ΔVolume / ΔPressure and ΔVolume is almost equal to ΔPressure
Pressure-derived measurements such as left ventricular end-diastolic pressure (LVEDP), left atrial pressure (LAP), PAOP, and CVP have traditionally been used in clinical settings as surrogate markers of intravascular volume. While these parameters may provide reasonable estimates in healthy individuals, their accuracy is limited in critically ill patients with IAH or ACS, where the assumptions required for interpreting PAOP and CVP as indicators of left and RV preload often do not apply (Figure 3).
Haemodynamic monitoring can only benefit patient management when clinicians are well versed in both the appropriate use and the inherent limitations of these measurements. In the physiologically complex setting of IAH or ACS, targeting fixed PAOP or CVP thresholds during resuscitation may be misleading. This approach risks inappropriate interventions, potentially resulting in under-resuscitation and subsequent organ dysfunction. Therefore, resuscitation strategies should be guided by a more comprehensive and individualised assessment rather than relying solely on absolute pressure values.
Improvement of barometric preload indices (transmural cardiac filling pressures)
In the context of elevated IAP and ITP, traditional filling pressures such as PAOP and CVP can be misleading. To improve accuracy, transmural pressures (PAOPtm and CVPtm) are calculated by subtracting ITP from end-expiratory PAOP or CVP [35, 38, 70]. Since ITP is often estimated via pleural pressure (Ppl), typically measured with an oesophageal balloon, and around 50% of IAP is transmitted to the thoracic cavity, a practical bedside estimate is [75]:
CVPtm = CVPee – IAP/2
PAOPtm = PAOPee – IAP/2
Alternatively, the abdomino-thoracic index of transmission (ATI) can be calculated as follows by measuring changes in CVP and IAP, allowing a more precise adjustment (Figure 4) [23]:
ATI = ΔCVP/ΔIAP
CVPtm = CVPee – (ATI × IAP)
PAOPtm = PAOPee – (ATI × IAP)
An alternative method to assess the TI of PEEP to barometric filling pressures can be calculated as follows [76]:
CVPtm = CVPee – TI × PEEPtot, with TI == (CVPei – CVPee)/(Pplat – PEEP)
Although calculating transmural filling pressures is physiologically sound and may better estimate preload in patients with IAH or ACS, it is not currently recommended in clinical practice. Studies have not shown that direct measurement of pleural pressure using an oesophageal catheter improves the ability of PAOP to predict volume responsiveness [75]. Since PAOP and CVP reflect both intravascular pressure and intrathoracic pressure, and because ventricular compliance fluctuates beat-to-beat in critically ill patients, pressure-based measures lose their reliability as indicators of true intravascular volume or preload status.
Role of volumetric preload monitoring in IAH
Volumetric preload monitoring offers a more accurate assessment of cardiac preload in patients with IAH by directly measuring cardiac volumes rather than relying on pressure-based surrogates.
FIGURE 4
Calculation of the abdomino-thoracic index of transmission (ATI) at the bedside. Simultaneous central venous pressure (CVP) and intra-abdominal pressure (IAP) tracing before and during abdominal compression (e.g. by applying an abdominal Velcro belt). The ATI can be calculated as follows: the change in end-expiratory CVP (∆CVPee = 13.5 – 8.5 mmHg = 5 mmHg) divided by the change in end-expiratory IAP (∆IAPee = 11 – 2 = 9 mmHg) and expressed as a percentage. ATI = ∆CVP/∆IAP = 5/9 = 55.6%. Adapted with permission from Malbrain MLNG et al. according to the Open Access CC BY Licence 4.0 [23]

Two main methods are used: continuous measurement of right ventricular end-diastolic volume index (RVEDVI) via a pulmonary artery catheter (PAC), and intermittent global end-diastolic volume index (GEDVI) using transpulmonary thermodilution (TPTD) systems such as PiCCO or EV1000.
RVEDVI is calculated as stroke volume index (SVI) divided by right ventricular ejection fraction (RVEF), providing a preload estimate independent of fluctuating ventricular compliance and elevated intrathoracic or intra-abdominal pressure. It has been shown to reliably predict volume responsiveness in various patient groups [77, 78].
PiCCO is a less invasive haemodynamic monitoring tool which combines calibrated TPTD and arterial pulse contour analysis [79]. Unlike uncalibrated systems (e.g., Vigileo), the calibrated PiCCO system offers improved accuracy [80, 81].
Additional parameters derived from TPTD include global ejection fraction (GEF), calculated as
GEF = (4 × SVI)/GEDVI
and measurements of extravascular lung water (EVLW), both of which help assess cardiac function and fluid status [82]. These volumetric measures provide valuable insights into preload status and capillary leak, particularly in critically ill patients with IAH.
Echocardiography plays a key role in predicting fluid responsiveness, typically defined as an increase in stroke volume (SV) of 15% or more following an intravenous fluid bolus. Studies have shown that 40–70% of patients in shock demonstrate a positive response to volume expansion [83]. Echocardiography provides both static and dynamic methods to assess fluid responsiveness in critically ill patients. Static measures, though limited in predictive accuracy, can offer contextual information, especially at extremes of volume status. Systolic obliteration of the LV cavity can be evaluated by tracing the endocardium at end diastole in parasternal short axis (SAX) view via TTE or deep transgastric SAX view via transoesophageal echocardiography (TEE). While the IVC diameter and LV end-diastolic area (LVEDA) are not considered reliable indicators of fluid responsiveness, they may offer useful insights into volume status when interpreted cautiously [84, 85]. IVC measurements are commonly used to estimate right atrial pressure (RAP): IVC diameter < 2.1 cm with > 50% inspiratory collapse → RAP ~3 mmHg. IVC diameter > 2.1 cm with < 50% inspiratory collapse → RAP ~15 mmHg. Dynamic indices, on the other hand, are more reliable and are based on changes in preload or heart-lung interactions. Techniques include observing responses to: a fluid bolus, passive leg raising (PLR), which provides a reversible auto-bolus of ~300–500 mL, and respiratory variations in vena cava dimensions [86–88]. Among dynamic indices, SVC collapsibility is considered the most reliable predictor of fluid responsiveness [89]. In spontaneously breathing patients and those with arrhythmias, PLR is the preferred assessment tool.
As previously discussed, IAH often leads to cardiac dysfunction and a reduced ejection fraction, evidenced by decreases in both RVEF and global ejection fraction (GEF). Given the dynamic nature of ventricular compliance in such patients, there is no universal target value for RVEDVI or GEDVI suitable for all cases of IAH or ACS [77, 78]. Instead, fluid resuscitation must be tailored to each patient, aiming to achieve the end-diastolic volume that optimises preload and systemic perfusion in that patient’s specific clinical context. Notably, adjusting GEDVI relative to the underlying GEF enhances its predictive value as a marker of preload and improves its utility in assessing fluid responsiveness [90].
EFFECT OF IAH ON CARDIAC CONTRACTILITY
Pathophysiology
IAH can significantly impair cardiac contractility due to the elevation of the diaphragm and the rise in ITP, both of which exert direct compressive forces on the heart (Figure 1). This compression also affects the pulmonary parenchyma, leading to increased pulmonary artery pressure (PAP) and elevated PVR, while simultaneously reducing LV preload.
As RV afterload rises, the thin-walled RV compensates by dilating, resulting in a decline in RVEF. This dilation can cause the interventricular septum to shift toward the LV cavity, further compromising LV filling and output. This phenomenon of interventricular interdependence can severely impair biventricular function and reduce CO. Echocardiography is a valuable tool in detecting these changes in patients with IAH [58, 90, 91].
Animal studies consistently demonstrate a decline in CO with rising IAP [35, 38, 70, 92]. In paediatric patients, Huetteman et al. [93] showed that anteroseptal LV wall motion decreased significantly at IAP levels as low as 12 mmHg during laparoscopic herniorrhaphy [93]. RV function may become worse in severe IAH which leads to worsening LV filling and CO [94, 95]. Moreover, in patients with heart failure, elevated CVP and IAP are both independent predictors of acute kidney injury. This interplay between cardiac dysfunction, raised IAP, and renal impairment has been termed CARS [29]. While early stages of IAH may respond to fluid resuscitation and inotropic therapy, advanced cases with pronounced biventricular dysfunction typically require non-surgical measures to reduce IAP or surgical abdominal decompression to restore cardiac function.
Abdominal perfusion pressure
Early efforts to identify a single “critical” IAP value to guide decision-making in IAH and ACS have proven overly simplistic. The pathophysiological response to elevated IAP is highly individualised and can vary not only between patients but also over time in the same patient [23, 96]. Therefore, a fixed IAP threshold is not universally applicable to critically ill patients [97].
To enhance clinical decision-making, APP – calculated as MAP minus IAP – has been proposed as a more physiologically relevant resuscitation target, similar to cerebral perfusion pressure (CPP).
APP = MAP – IAP
Maintaining an APP of 50–60 mmHg may serve as a more effective endpoint for resuscitation than traditional macro- and microcirculatory markers. Studies suggest that APP outperforms other parameters such as arterial pH, lactate, base deficit, and urine output (UO) in predicting survival in surgical patients with IAH or ACS [3].
A recent prospective study in patients with critically ill patients with liver cirrhosis showed that high APP correlated with worse outcomes [4]. However, despite the theoretical advantages and promising findings, APP lacks robust validation through large-scale, prospective multicentric trials. As such, while it may be a useful adjunct in assessing perfusion in IAH, current evidence is insufficient to recommend APP as a standard resuscitation endpoint.
EFFECT OF IAH ON AFTERLOAD
Elevated IAP and ITP contribute to increased afterload by mechanically compressing the aorta and systemic vasculature, thereby raising SVR, and by compressing the pulmonary parenchyma, which elevates pulmonary vascular resistance (PVR). Additionally, organ compression may disrupt neurohormonal regulation, including activation of the renin–angiotensin–aldosterone system [98, 99]. More commonly, however, elevated SVR develops as a compensatory mechanism in response to reduced venous return and declining SV. This compensatory vasoconstriction often helps maintain MAP in the early stages of IAH or ACS, despite declining cardiac output.
Patients with compromised cardiac function or reduced intravascular volume may not tolerate these increases in afterload, leading to further haemodynamic instability [77, 100–102].
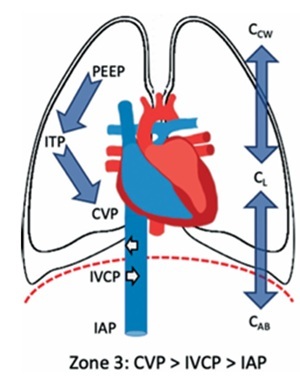
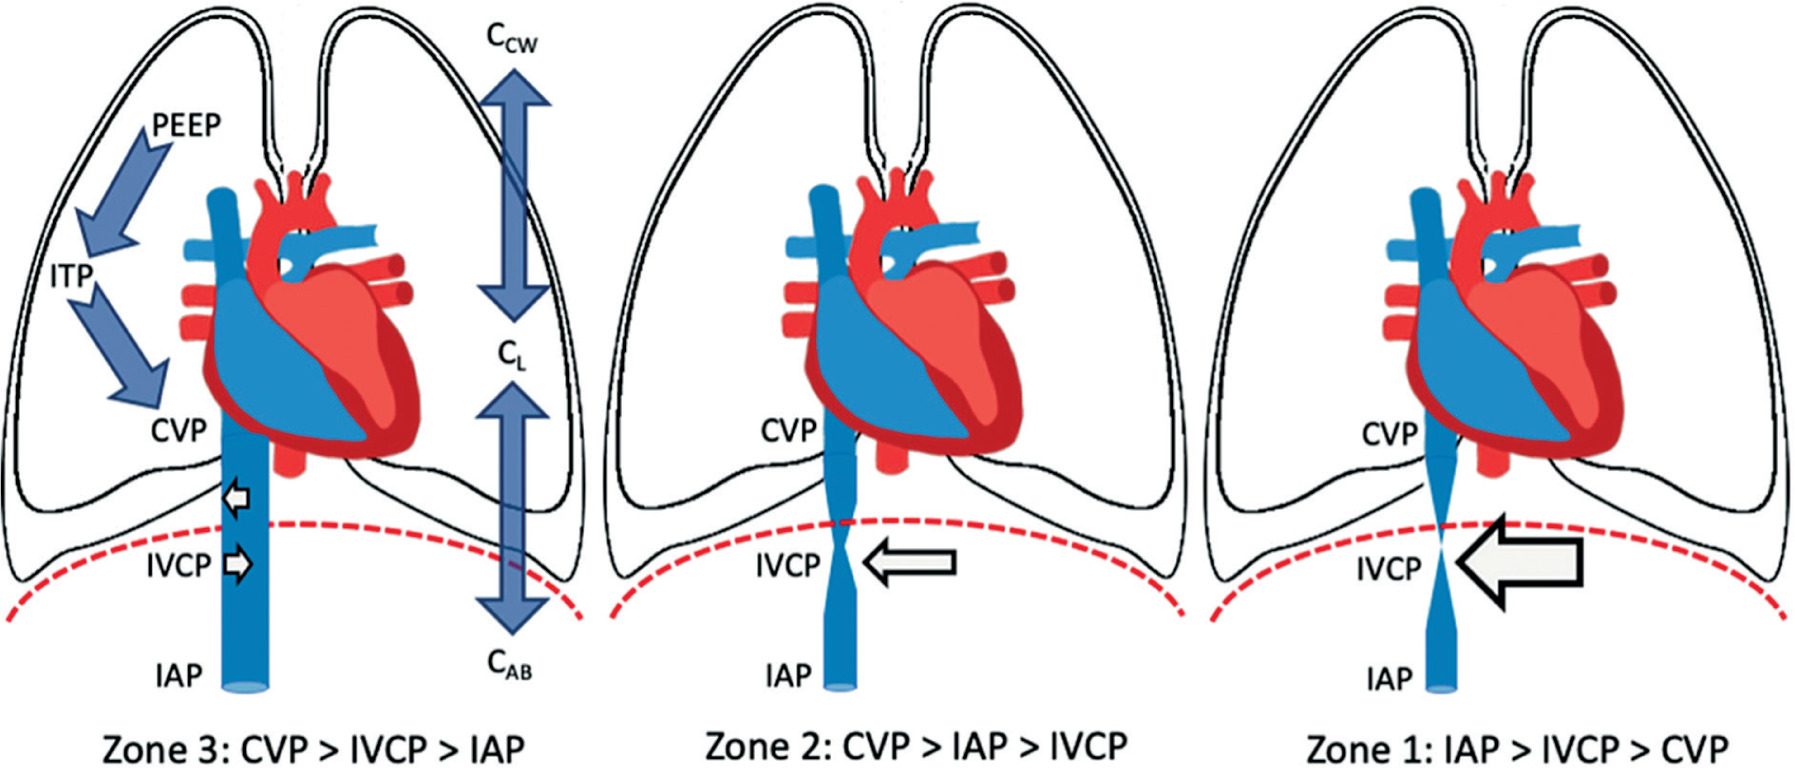
The concept of abdominal vascular zones, analogous to West’s pulmonary vascular zones, helps explain changes in venous return in IAH (Figure 5) [52]. When the transmural pressure of the IVC – defined as IVC pressure minus IAP – exceeds a critical closing threshold (Zone 3 abdomen) [65], venous return is preserved. This typically occurs in hypervolaemic states, where the abdominal venous compartment acts as a capacitance reservoir.
Conversely, in hypovolaemic conditions (Zone 2 abdomen), where the transmural IVC pressure falls below this threshold, venous return is significantly impaired. In this setting, the abdominal venous compartment behaves like a collapsible Starling resistor [103]. These dynamics are particularly relevant in hypovolaemic or non-cardiogenic shock patients, especially when positive pressure ventilation and high PEEP levels are used, both of which further reduce CO under elevated IAP [103].
FIGURE 5
Abdominal West zones. The abdomen can be divided into discrete regions according to the interplay between intra-abdominal pressure (IAP), central venous pressure (CVP) and inferior vena cava pressure (IVCP). These regions are zone 1, where IAP is higher than IVCP or CVP; zone 2, where the IAP is lower than the CVP but higher than the IVCP and zone 3, where both CVP and IVCP are higher than IAP. Other contributing factors (but more difficult to assess) are the compliance of the lungs (CL), chest wall (CCW) and abdominal wall (CAB) as well as the use of positive pressure ventilation with positive end-expiratory pressure (PEEP) and intrathoracic pressure (ITP). Adapted with permission from Malbrain MLNG et al. according to the Open Access CC BY Licence 4.0 [52]
Additionally, mean systemic filling pressure may increase during IAH, as observed in preeclamptic pregnancies [104] and critically ill patients [105], possibly explaining the heightened risk of pulmonary oedema with even minimal fluid administration in such scenarios.
EFFECT OF IAH ON FUNCTIONAL HAEMODYNAMICS AND FLUID RESPONSIVENESS
Elevated IAP raises intrathoracic pressure, driving up stroke-volume variation (SVV), pulse-pressure variation (PPV) and the Δup component of systolic-pressure variation. Yet these shifts do not automatically indicate fluid responsiveness: they can reflect altered aortic compliance, measurement artefacts, or changes in pleural pressure and chest-wall mechanics. When IAP reaches roughly 25 mmHg, PPV still predicts volume response, but its best cut-off rises to ≈20.5% instead of the usual 12%. Any threshold must be adjusted for tidal volume, PEEP, obesity, heart or lung disease, pneumoperitoneum, and paediatric status. Clinically, PPV outperforms the ostensibly “purer” SVV, hinting at complex waveform effects of intrathoracic pressure. Notably, in a severe-pancreatitis model, SVV-guided resuscitation improved survival and microcirculation – findings that may translate to patients with IAH [102].
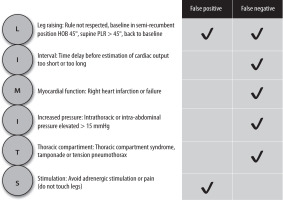
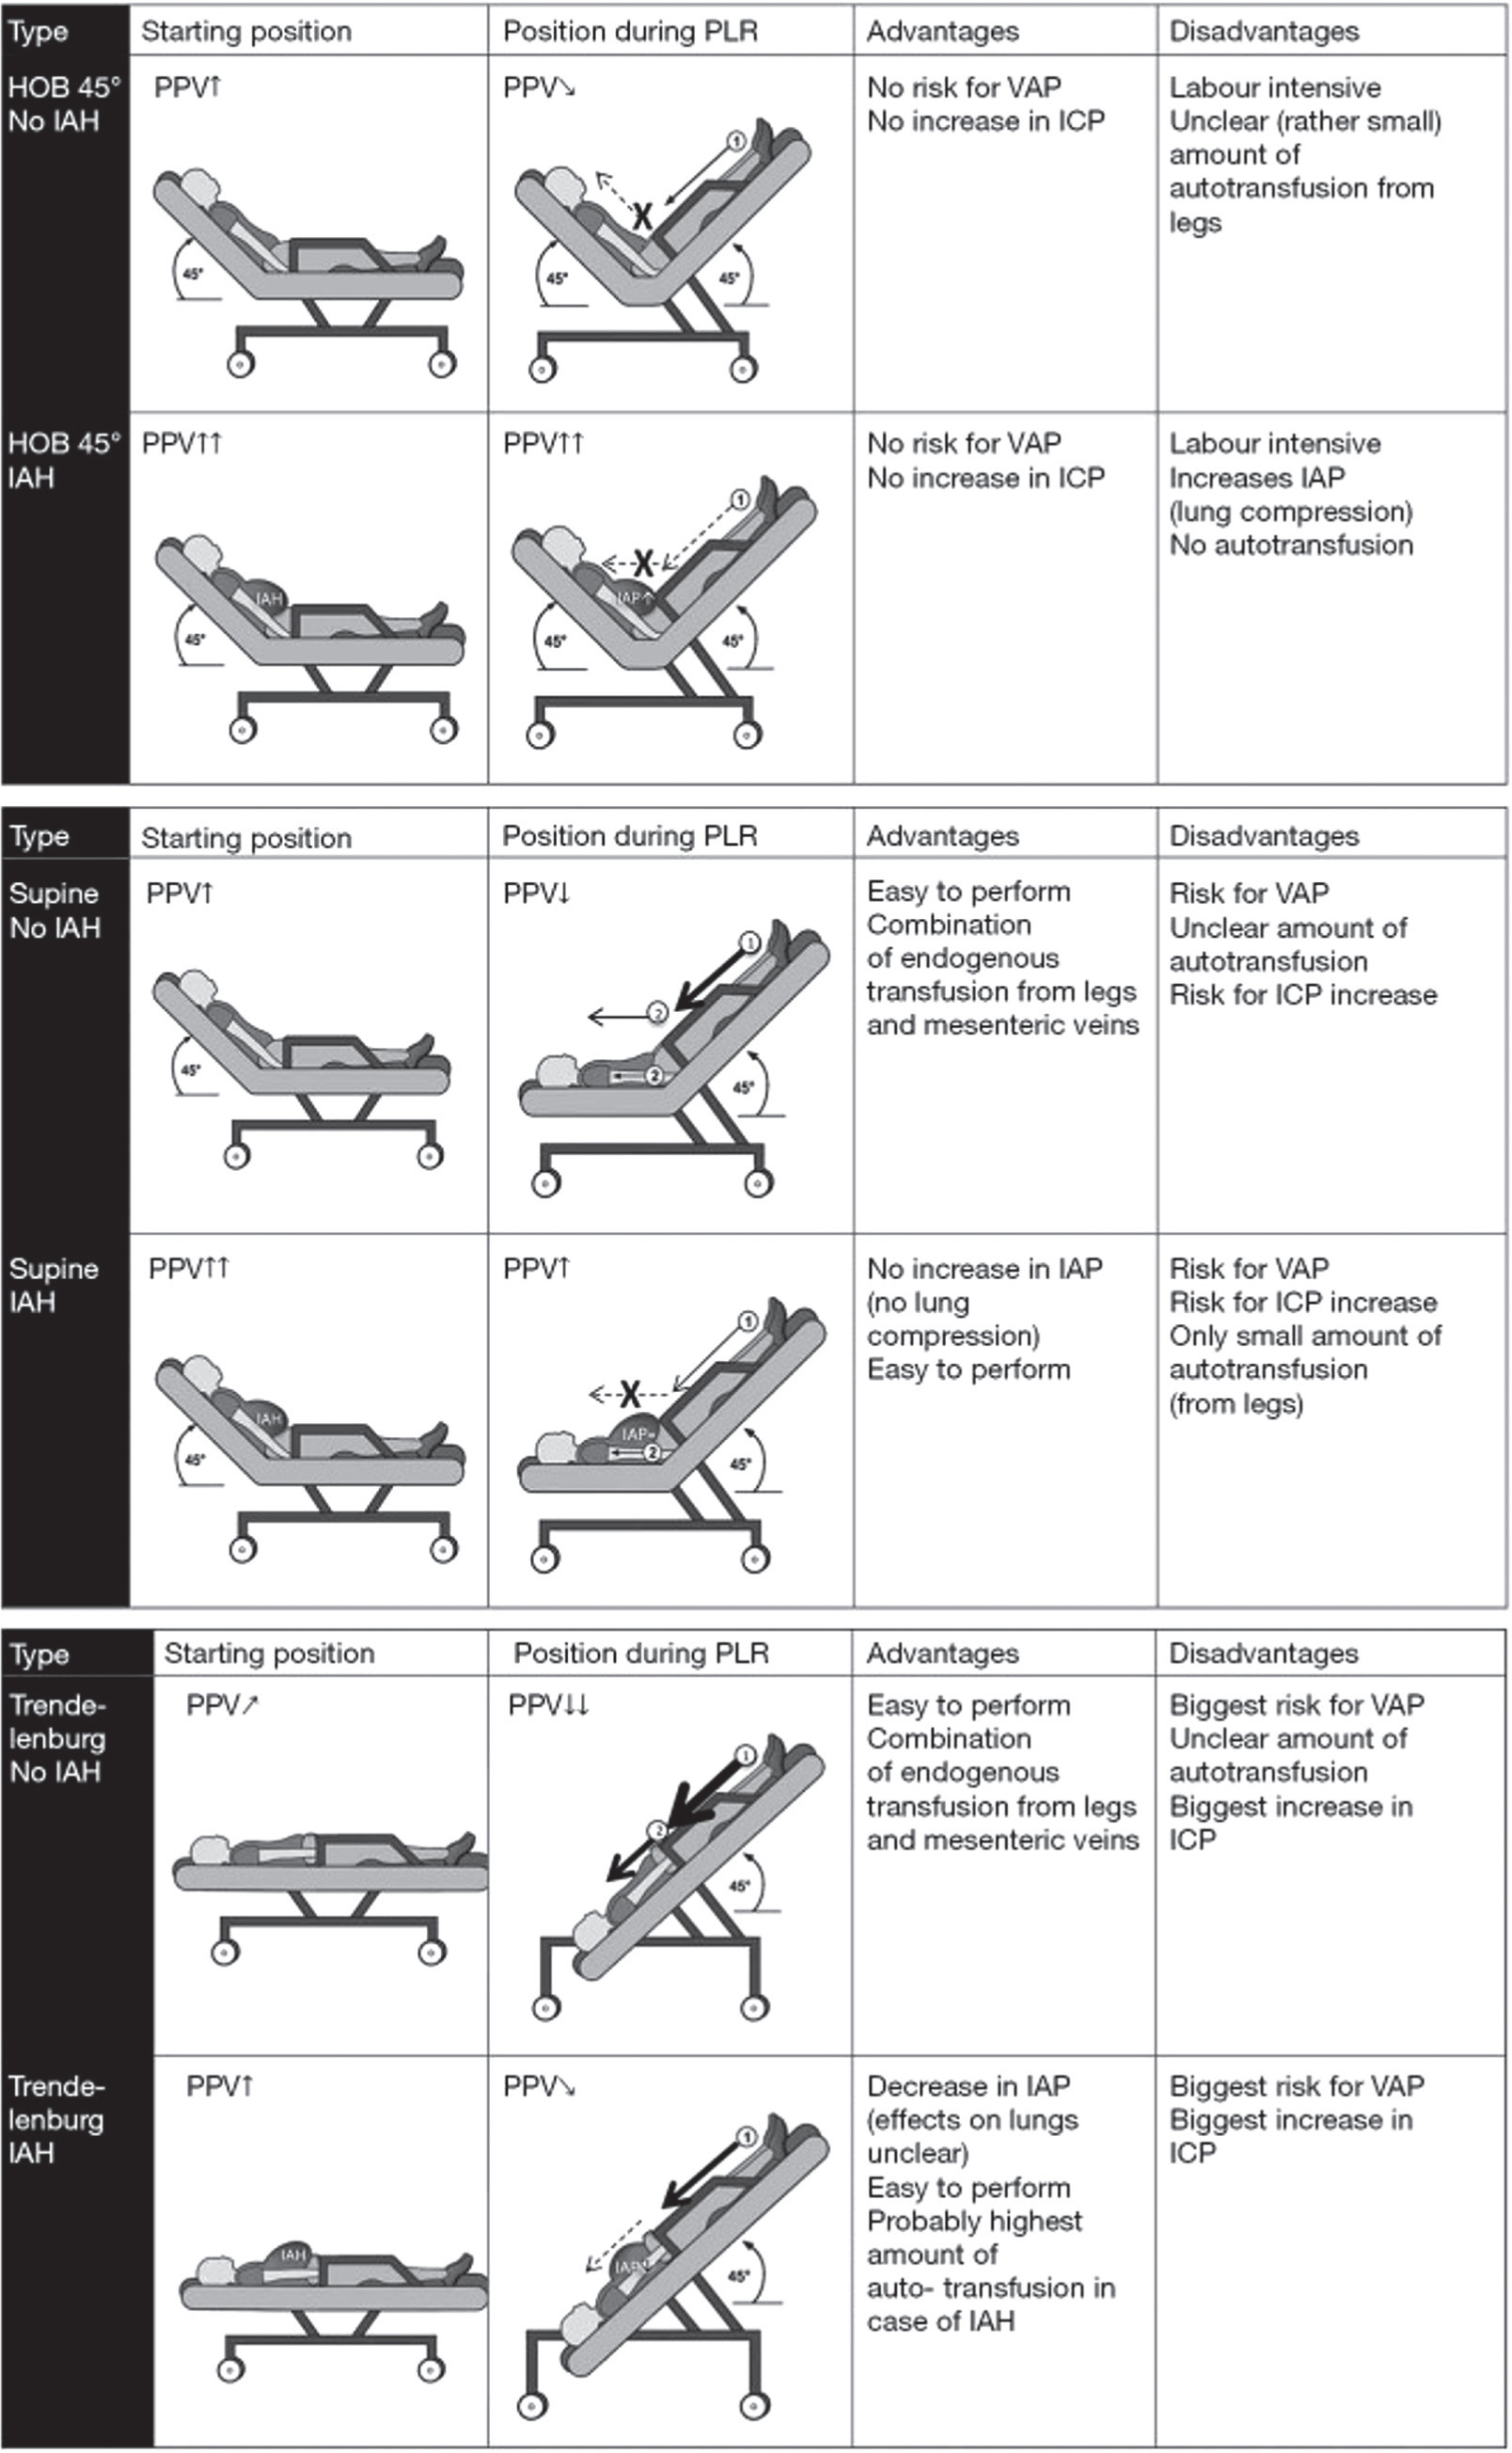
Roughly 25% of ICU patients show PPV > 12% yet still fail to respond to fluids, often because right-ventricular dysfunction inflates the value [103]. Passive-leg-raising (PLR) can be equally deceptive: high IAP limits venous return and turns true responders into false negatives [104, 105], Because PLR’s “auto-infusion” varies with body habitus and starting posture, IAP should always be checked when interpreting the test. A PLR from a 45° head-of-bed position further elevates IAP and adds little leg flow; from supine it leaves IAP unchanged but still misses mesenteric return; Trendelenburg lowers IAP and boosts venous return from both legs and splanchnic beds (Figure 6 and 7) [105].
SUGGESTED RECOMMENDATIONS
These recommendations are suggested and merely reflect the personal experience of the coauthors. They do not aim to provide an exhaustive, graded and concise overview of the literature, as current evidence is mostly limited to observational, retrospective or small clinical studies, and more randomized trials are needed to better establish a personalized approach to fluid management. These recommendations could however form the basis for a more elaborated consensus statement via a modified Delphi methodology.
Monitoring. Every patient with septic shock should be adequately monitored with regard to cardiac output, fluid status, fluid responsiveness and organ perfusion.
IAP monitoring. When 2 or more IAH risk factors are present, baseline IAP monitoring should be obtained via the bladder.
Continuous IAP monitoring. When available, continuous IAP monitoring is preferred over intermittent.
Cardiac output. When treating shock patients, by definition, CO should be monitored to identify patients with low or high CO and to assess the response to treatment. A calibrated technique, either PAC or TPTD, is preferred.
Barometric preload. Barometric preload indicators, such as CVP or PAOP, should not be used to guide fluid resuscitation in patients with septic shock and/or IAH.
Chasing a static CVP target of 8 to 12 mmHg as the resuscitation endpoint may lead to over- or under-resuscitation and should be abandoned.
Transmural filling pressures, or their estimates, may better reflect the true preload status (especially in patients with high PEEP and IAP) and thus could be a better resuscitation endpoint.
Perfusion pressure. Chasing a static MAP target of 65 mmHg may be too low or too high, and therefore MAP should be tailored individually.
In patients with abdominal hypertension, perfusion pressures should be calculated:
UO monitoring. UO is a poor endpoint that may lead to over- or under-estimation of fluid resuscitation and, as such, can no longer be recommended. When available, continuous UO monitoring should be used.
Mixed venous saturation. As chasing an ScvO2 target of 70% in isolation does not make sense, ScvO2 should always be seen in relation to previous history, co-morbidities and actual lactate levels.
Volumetric preload. Volumetric preload indicators (such as RV or global end diastolic volume) are superior compared to those which are barometric and are recommended to guide fluid resuscitation, especially in septic patients with increased ITP or IAP.
FIGURE 6
Effects of different passive leg raising tests. Schematic overview comparing the possible effects and (dis)advantages of PLR test in (A) HOB 45°, (B) supine, (C) Trendelenburg during normal IAP and IAH. Schematic overview comparing the possible effects and (dis)advantages of different passive leg raising (PLR) tests during normal IAP and IAH. The PLR can be performed from HOB (A) or supine (B) position or putting the patient in the Trendelenburg position (C). Endogenous fluid resuscitation comes from venous return from the legs and the mesenteric veins. The amount of the endogenous fluid resuscitation is indicated by the thickness of the arrow. Adapted from Minini et al. with permission [106]. A dotted line marked with “X” indicates the absence of endogenous trans-fusion from that region. PPV – pulse pressure variation, ICP – intracranial pressure, VAP – ventilator-associated pneumonia, IAP – intra-abdominal pressure, IAH – intra-abdominal hypertension, HOB – head of bed
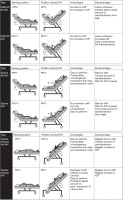
FIGURE 7
Most common physiological limitations to the use of passive leg raising (PLR) can be summarized as ‘LIMITS’. Adapted from Minini et al. with permission [106]
If the RVEDVI or GEDVI is high, the measurement needs to be corrected for the global ejection fraction, as this leads to a more accurate estimation of preload.
Point-of-care ultrasound (POCUS) using TTE and TEE – left ventricular end-diastolic area (LVEAD) assessment.
POCUS IVC.
POCUS–venous excess ultrasound (VExUS).
Fluid responsiveness. Fluid resuscitation in septic patients should be guided by physiological parameters (SVV or PPV) or tests that are able to predict fluid responsiveness (passive leg raising or end expiratory occlusion test).
Functional haemodynamic targets should be adapted in presence of IAH.
Passive leg raising can be falsely negative in presence of IAH.
Fluid balance. An excessive positive daily and cumulative fluid balance should be avoided, as this is linked to secondary IAH and ACS.
Electrolytes. Excessive sodium and chloride in-take (fluid creep) should be avoided.
Lung water. The use of the extravascular lung water index (EVLWI) is recommended to guide de-resuscitation in septic patients with IAH not transgressing spontaneously from the ebb to flow phase.
Perfusion. Fluid resuscitation should only be given/increased in case of evidence of tissue hypoperfusion (base deficit, lactate, etc.).

CONCLUSIONS
The haemodynamic consequences of IAH and ACS are significant. The cardiovascular consequences are multifactorial, including direct effects on cardiac performance and indirect effects from regional organ or tissue ischaemia. It is important to recognise the patient at risk of IAH and to monitor intra-abdominal pressure. Clinical management should be cognizant of intravascular volume and potential effects of IAP on venous return, and the necessity for clinical management to be guided by careful haemodynamic assessment and phenotyping of the patient’s haemodynamic profile using clinical, ultrasonographic and other haemodynamic monitoring tools.