
In patients with shock, hemodynamic stabilization through intravenous fluid therapy represents a major therapeutic challenge due to uncertainties regarding the type, dose, timing, and duration of fluid administration [1]. Fluids are drugs, and inappropriate use, misuse, or overuse can lead to detrimental complications [2]. Furthermore, the approach and strategy of fluid administration play a pivotal role in patient management. A recently proposed model for guiding fluid therapy during shock consists of four dynamic and sequential phases, summarized by the acronym ROSE: Resuscitation, Optimization, Stabilization, and Evacuation [3, 4].
Resuscitation: In this initial phase, which typically occurs within the first 3 to 6 hours after the initial insult, volume resuscitation is guided by an early, adequate, and goal-directed strategy [5]. Therapeutic goals should be individualized for each patient [6]. During this phase, the percentage of fluids accumulated (FA%) should be positive [4].
Optimization: This subsequent phase occurs within a few hours and is related to ischemia and reperfusion. At this stage, fluid accumulation (FA) reflects the severity of the clinical condition and may serve as a biomarker of illness severity. The focus is on organ rescue. In this phase, the FA% should be neutral [4].
Stabilization: Unlike the previous phases, this stage is characterized by the absence of shock or imminent threat of shock in the following days. The focus shifts to organ support, and the patient is in a state of hemodynamic stability [4]. The therapeutic goal is late conservative fluid management. At this stage, the FA% should be neutral or negative [4].
Evacuation: In this phase, the patient enters the “flow” phase, characterized by the spontaneous elimination and excretion of previously administered excess fluids. In some cases, however, the patient remains in a “no-flow” state and may progress to a global increased permeability syndrome (GIPS), requiring de-escalation or even de-resuscitation strategies such as diuretics and renal replacement therapy (RRT) [7, 8]. In this phase, the FA% should be negative [4].
The management of patients in shock based on these four ROSE phases of fluid therapy aims to reduce FA, which, when excessive, can lead to deleterious effects and contribute to adverse clinical outcomes such as prolonged invasive mechanical ventilation (IMV), extended hospital and intensive care unit (ICU) length of stay, need for RRT, and increased risk of mortality [9]. Some studies have described the phases of fluid therapy based on the ROSE concept in adult patients with hemodynamic instability; however, no studies to date have addressed this approach in the pediatric population admitted to the ICU [10–12]. In light of the above, this study aimed to implement the ROSE fluid therapy concept in critically ill patients in the pediatric intensive care unit (PICU), to analyze the phases of fluid therapy and intervention strategies, to calculate the FA% at the end of each phase, and to examine the association between these changes and clinical outcomes, by comparing the periods before and after the implementation of the ROSE concept.
METHODS
Ethical regulations
The study was conducted in accordance with the study protocol, the Declaration of Helsinki, and applicable regulatory requirements. The local Institutional Review Board and Ethics Committee of the Federal University of Minas Gerais approved the protocol (with EC approval number: CAAE: 53411820.4.0000.5149 for the retrospective part and CAAE: 63618322.9.0000.5149 for the prospective part). Approval from the local bioethics committee was also obtained for conducting this study. The initial phase of the study was retrospective and observational, informed consent was waived, and only the Data Usage Commitment Agreement was signed by the researchers. In the prospective phase, written informed consent was obtained for all participants, after provision of detailed information about the study.
Quasi-experimental study
This was a quasi-experimental before-andafter (pre/post-implementation) study, consisting of a retrospective phase conducted prior to the implementation of the ROSE framework (January 2020 to December 2022) and a prospective phase following its implementation (February 2023 to January 2025). Critically ill patients were defined as those requiring IMV and vasoactive amines during hospitalization. Patients with PICU stays longer than twenty days were excluded due to the potential positive influence of nutritional support on the calculation of FA%. In January 2023, the PICU care team underwent training and education on the ROSE fluid therapy concept to enable its implementation and subsequent comparative analysis of data obtained from the retrospective and prospective phases of the study.
Data collection
Data collection included patient demographics and characteristics (sex, age, weight, height, gender), Pediatric Index of Mortality (PIM3), diagnosis at PICU admission, identification, progression, duration of each phase, and calculation of FA% at the end of each fluid therapy phase according to the ROSE concept. The FA% was calculated using the following formula, introduced by Goldstein et al. [13].
To assess the effects of FA, patients were allocated to two groups: before and after the implementation of the ROSE concept. The identification of ROSE phases was based on a structured clinical algorithm integrating metabolic, hemodynamic, and therapeutic parameters. Phase transitions were defined using trends in arterial lactate levels, vasoactive drug requirements, and overall clinical stability. A lactate threshold of < 1.3 mmol L–1 was used as a reference for phase transition based on institutional laboratory standards for normal perfusion and supported by prior pediatric studies evaluating lactate normalization as a marker of shock resolution. Importantly, lactate values were interpreted longitudinally rather than as isolated measurements, in conjunction with decreasing vasoactive support and absence of clinical signs of hypoperfusion [14]. Data were obtained from handover forms, electronic medical records, and longitudinal patient monitoring. To enhance reproducibility, phase classification was independently reviewed by two investigators, with discrepancies resolved by consensus. The Resuscitation phase was characterized as the initial period of shock, lasting from minutes to a few hours, marked by the need for rapid fluid resuscitation, initiation of vasoactive support, and elevated serum lactate levels. The Optimization phase was defined as a period lasting several hours, during which there was reduced need for fluid administration, titration of vasoactive agents, and persistent elevation of lactate levels. The Stabilization phase was identified as a phase lasting from hours to days, characterized by the progressive tapering or discontinuation of vasoactive medications and a downward trend in lactate concentrations. The Evacuation phase was defined as a prolonged period, typically spanning several days, during which there were no longer clinical signs of shock, and fluid removal occurred either spontaneously through diuresis or via active de-resuscitation strategies. Team adherence was assessed by calculating the FA% at the end of each phase of the ROSE framework during the study and comparing it to the FA% targets previously established in the literature [4]. The trajectory of cumulative fluid balance (CFB) was assessed based on evidence from the literature [3, 4]. Patients who remained with FA were those who failed to transition from the EBB phase to the FLOW phase, whereas those who achieved progressive fluid elimination (FE) corresponded to individuals who successfully completed the transition from EBB to FLOW [4].
Primary and secondary endpoints
The primary endpoint was the limitation of FA%. The evaluated secondary outcomes were duration of IMV, amount of vasoactive amines used, length of stay in the PICU, and progression to RRT.
Statistical analysis
The normality of continuous variables was assessed with the Kolmogorov-Smirnov test. Student’s t-test was used for parametric variables, and the Mann-Whitney U test for non-parametric variables, with results expressed as mean ± standard deviation or median (interquartile range). A significance level of 5% was adopted. Comparison of FA% between the two studies was performed using Student’s t-test for independent samples. Sample size estimation assumed a type I error (α) of 0.05, type II error (β) of 0.20 (power = 80%), and a moderate effect size (Cohen’s d = 0.50). FA was analyzed using univariate and multivariable binary logistic regression, estimating odds ratios with 95% confidence intervals and statistical significance assessed by the Wald test (P < 0.05).
RESULTS
Patient demographics
The study sample consisted of 122 pediatric patients admitted to the PICU, with 71 in the retrospective group and 51 in the prospective group. The general characteristics of the studied population are presented in Table 1 and Supplementary Table 3.
TABLE 1
Characterization of patients regarding the variables sex, age range, age, nutritional status, clinical background, oncohematological, sepsis and PIM3 of patients in total, in the retrospective phase, and in the prospective phase of the study
Fluid accumulation across PICU stay
There were no statistically significant differences in FA% between the retrospective and prospective groups on days 1, 3, and 10 of PICU stay. On day 1, the median FA% was 1.85% (0.28–4.30) in the retrospective group and 1.90% (0.80–3.20) in the prospective group (P = 0.934). On day 3, the median values were 5.50% (1.75–10.30) and 6.10% (3.80–10.20), respectively (P = 0.565). On day 10, the retrospective group had a median FA% of 8.30% (0.84–24.80), compared to 7.25% (2.69–18.73) in the prospective group (P = 0.848).
Clinical parameters across ROSE phases
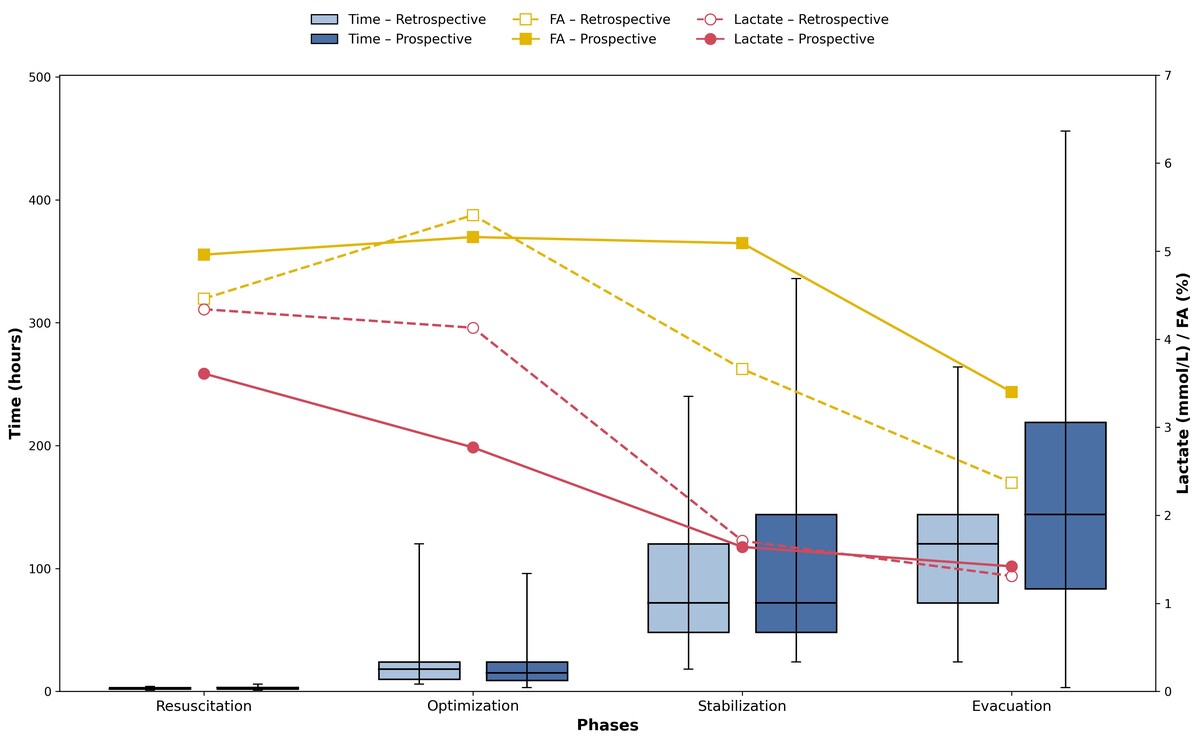
The analysis of clinical parameters across the four phases of the ROSE concept in the retrospective and prospective cohort showed progressive variations in both the duration of each phase and the values of FA% and lactate. The mean duration increased progressively from the Resuscitation to the Evacuation phase, ranging from 2.2 ± 0.7 to 114.7 ± 58.4 hours in the retrospective cohort and from 2.6 ± 1.0 to 169.1 ± 110.6 hours in the prospective cohort. In parallel, lactate levels declined steadily, from 4.3 ± 2.8 mmol L–1 in the retrospective cohort and 3.6 ± 2.2 mmol L–1 in the prospective cohort during Resuscitation, to 1.3 ± 0.4 and 1.4 ± 0.4 mmol L–1, respectively, during Evacuation. The median values of FA% varied throughout the study phases, with no significant differences between the groups. In the Resuscitation phase, the median was 3.5% in the retrospective group and 4.7% in the prospective group (P = 0.244). In the Optimization phase, values remained similar between groups, with medians of 3.0% and 4.2%, respectively (P = 0.261). During the Stabilization phase, the median was 2.5% in the retrospective group and 4.2% in the prospective group (P = 0.043). Finally, in the Evacuation phase, the medians were 2.5% and 2.4%, respectively, with P = 0.256. Clinical parameters across ROSE phases are presented in Figure 1 and Supplementary Tables 4–6.
Therapeutic interventions across ROSE phases
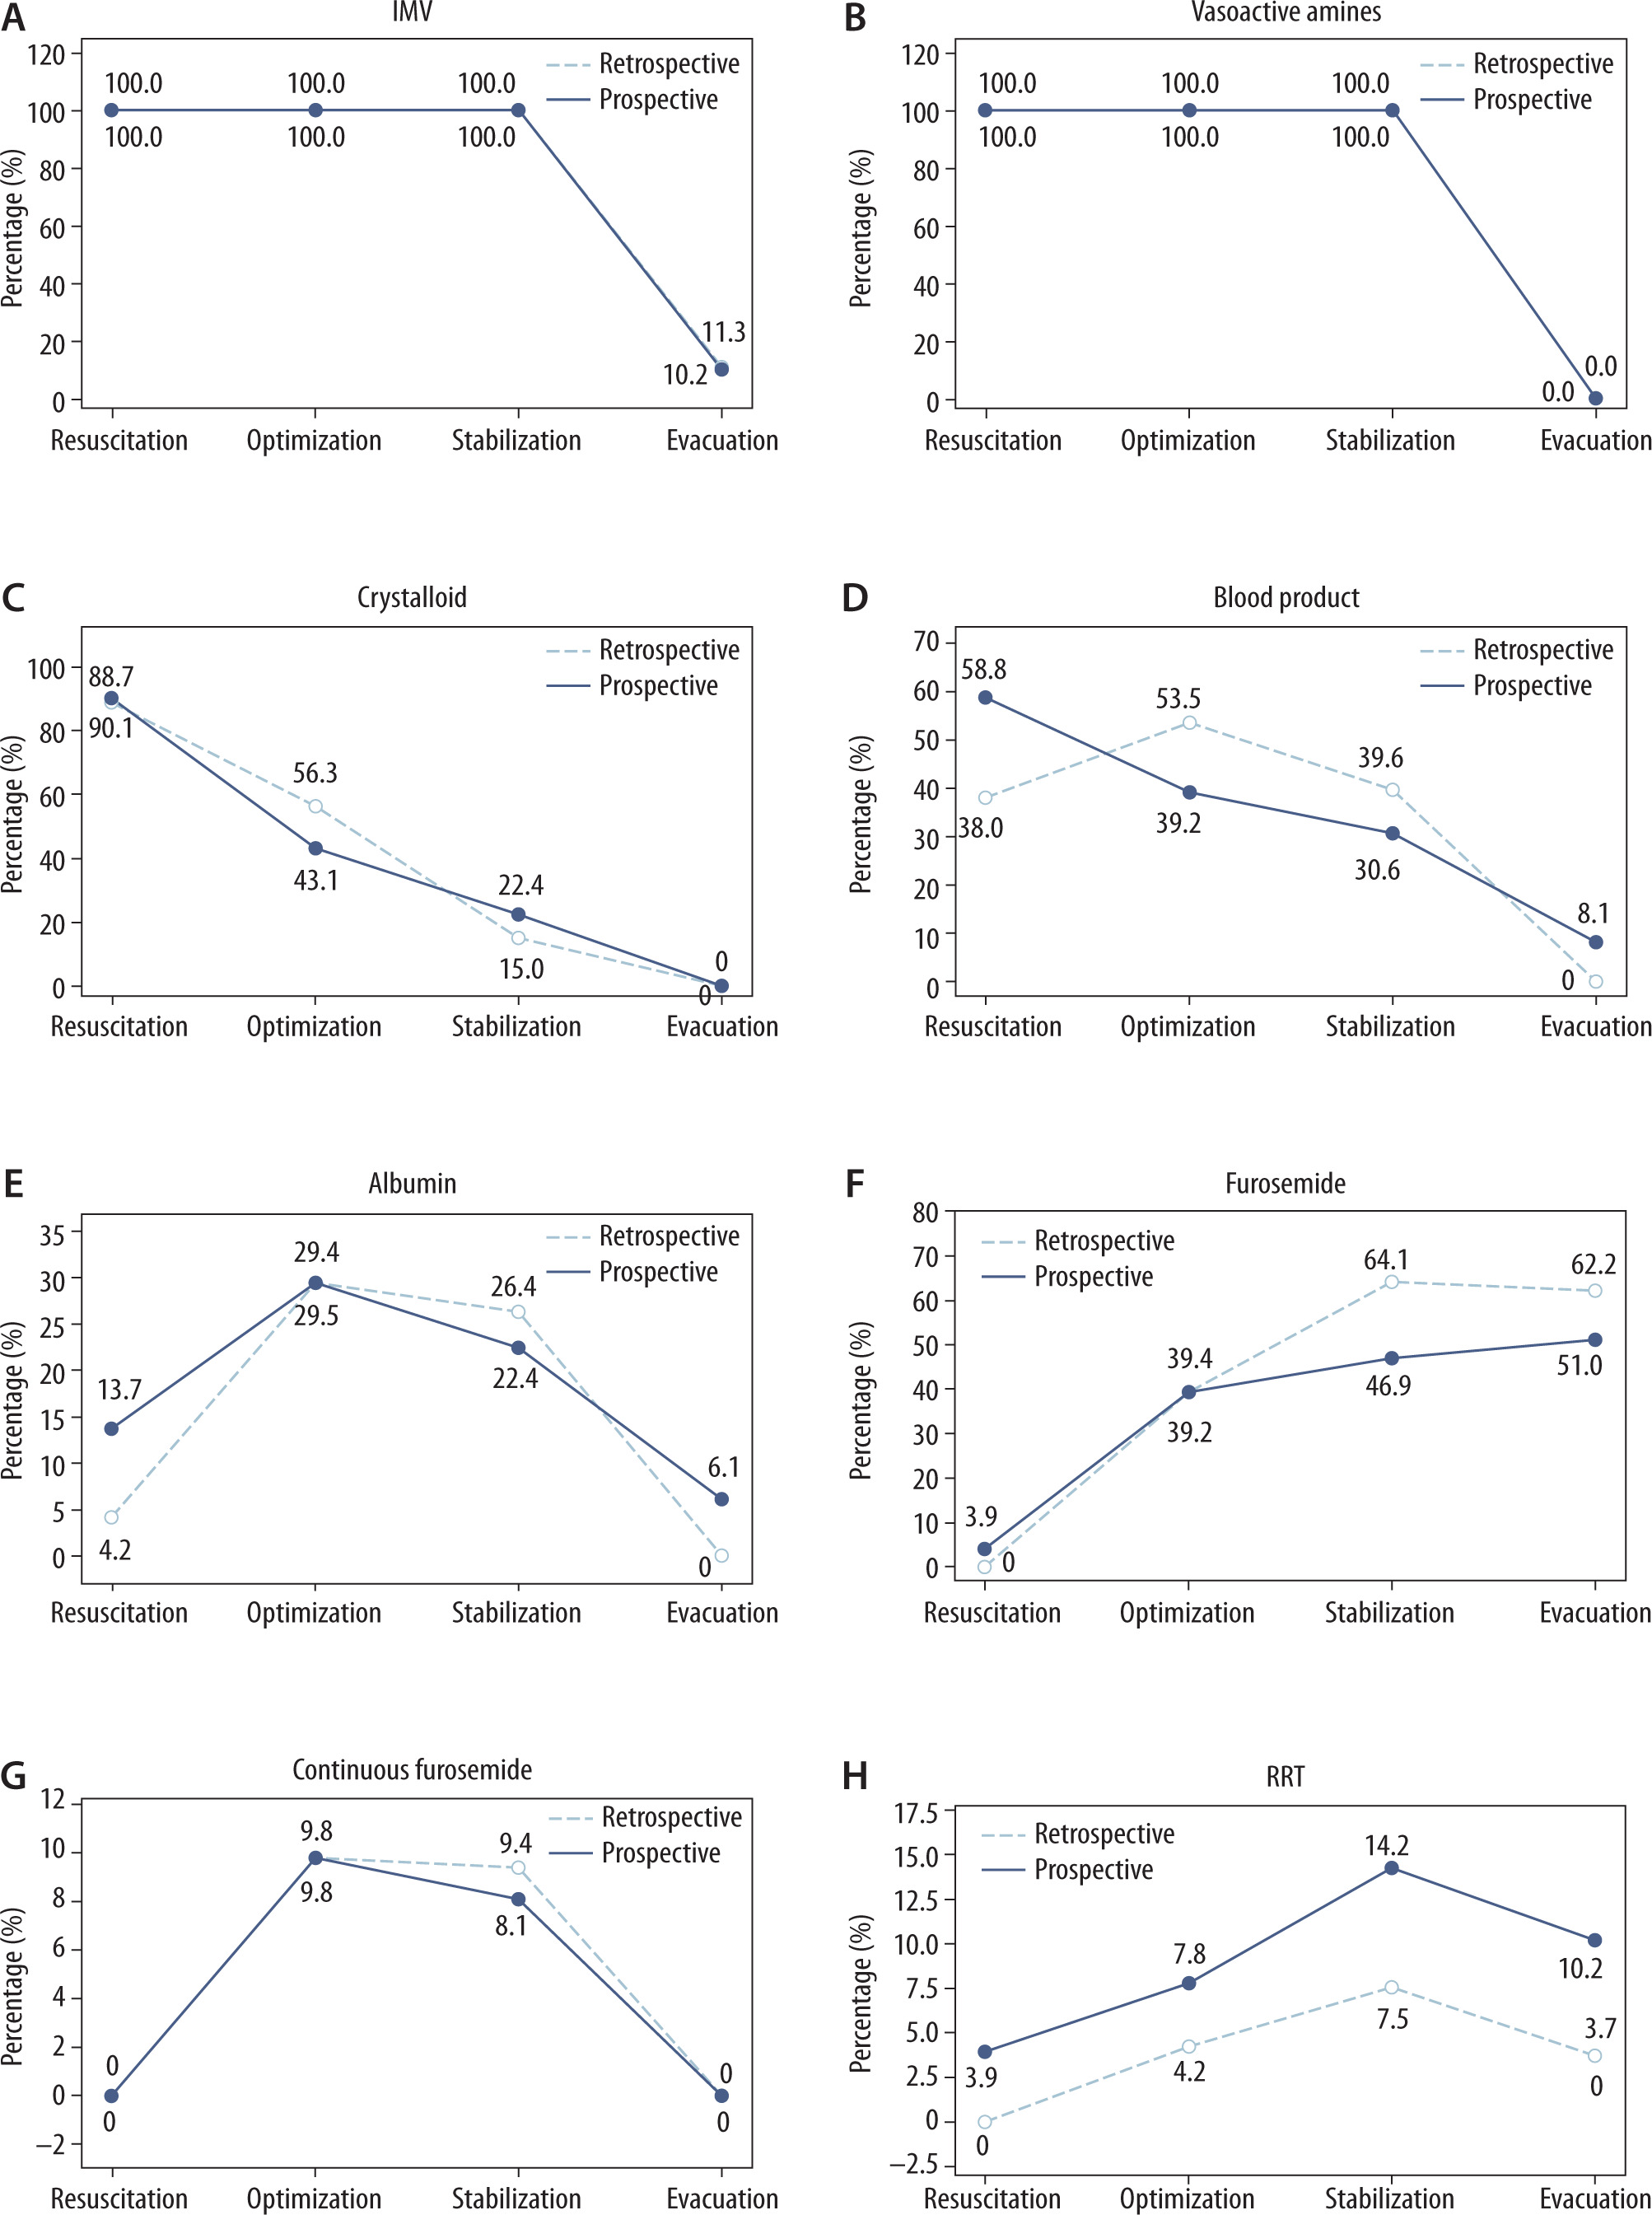
The distribution of therapeutic interventions across the phases of the ROSE concept revealed that IMV and vasoactive drugs were universally used during the Resuscitation and Optimization phases, in the retrospective and prospective cohorts, with a gradual reduction in subsequent phases. The use of crystalloids and blood products was more frequent in the Resuscitation phase and progressively declined thereafter in both cohorts. The administration of albumin peaked during the Optimization phase, with 10% albumin being the most frequently used concentration at this stage. Furosemide use, in bolus form, increased progressively and was most prevalent during the Stabilization and Evacuation phases. Continuous furosemide infusion was administered during the Optimization and Stabilization phases in both cohorts, reaching a maximum dose during the Stabilization phase. RRT was most used during the Stabilization phase. Therapeutic interventions across ROSE phases are presented in Figure 2 and Supplementary Tables 7 and 8.
FIGURE 2
Analysis of the need for A) invasive mechanical ventilation (IMV), B) vasoactive amines, C) crystalloid, D) blood product, E) albumin, F) furosemide, G) continuous furosemide, and H) renal replacement therapy (RRT) across the Resuscitation, Optimization, Stabilization, and Evacuation phases in the retrospective and prospective cohorts
Clinical outcomes
The analysis of clinical outcomes showed that the number of vasoactive amines used and duration of IMV were comparable between the groups.
Length of stay in the PICU was slightly longer in the prospective group compared to the retrospective group, but without statistical significance. The need for RRT occurred in 12.3% of 122 patients, with no significant difference between groups. Although mortality was significantly lower in the prospective cohort (3.9% vs. 25.4%, P = 0.002), this finding should not be interpreted as an effect of ROSE implementation. During the prospective phase, several patients with early clinical deterioration or rapid progression to death were not included due to the inability to obtain informed consent in a timely manner, introducing a selection bias. The clinical outcomes are presented in Table 2.
TABLE 2
Clinical outcomes and cumulative fluid balance trajectory according to patient groups: total, retrospective, and prospective analyses
Cumulative fluid balance trajectory
The CFB trajectory in survivors was also evaluated throughout the retrospective and prospective phases of the study. In the retrospective phase of the study, 47.2% of patients developed FA vs 34.7% in the prospective phase (P = 0.201). To evaluate potential risk factors associated with FA, univariate binary logistic regression was performed in the survivors (n = 102), considering the variables age < 3 years, low weight, onco-hematologic condition, sepsis, and PIM3. None of these variables showed a statistically significant association with FA, according to the P-values obtained. The multivariable model also did not identify any statistically significant associations between the clinical variables evaluated and the occurrence of FA. The univariate binary logistic regression and multiple logistic regression analysis to identify risk factors associated with fluid accumulation are presented in Supplementary Tables 9 and 10.
Adherence to FA% targets in ROSE phases
Adherence to the resuscitation goal was 100% in both phases. With respect to optimization, 56.6% of patients in the Retrospective phase achieved the target, compared with 67.3% in the Prospective phase. During the Stabilization phase, adherence was observed in 62.2% of retrospective patients and 57.1% of prospective patients. In the Evacuation phase, the goal was reached by 52.8% of patients in the retrospective phase and by 65.3% in the prospective phase. Overall, the total adherence rate to the goals was 67.9% in the retrospective phase and 72.4% in the prospective phase.
DISCUSSION
General findings
Although widely adopted in adult intensive care, the ROSE concept has not yet been formally validated or systematically applied in pediatric fluid therapy studies. The pediatric literature focuses mainly on aspects such as fluid type and volume, infusion rate, and predictors of fluid responsiveness, but does not typically organize interventions or outcomes according to the ROSE model phases [15, 16]. Large clinical trials, such as the FEAST study, and recent systematic reviews, although relevant to the management of critically ill children, did not incorporate the ROSE framework into their design [17, 18]. Previous studies have indicated that younger children and those with lower body weight are at greater risk for FA and worse outcomes in the PICU, whereas gender does not appear to be a determining factor in fluid therapy related outcomes [19, 20]. The present study found no statistically significant differences in gender, age, or age group when comparing the retrospective and prospective cohorts of critically ill pediatric patients undergoing fluid therapy assessment, suggesting that these factors, in isolation, did not influence adherence to fluid management.
Primary outcome: fluid accumulation
The findings of the present study demonstrated median FA% values consistent with those described in the literature as safe and associated with a lower risk of complications. No statistically significant differences were observed between the retrospective and prospective groups in FA% on days 1, 3, and 10 of PICU stay, with similar medians across both periods. On day 1, both cohorts had median FA% values below 2%, in line with the data reported by Alobaidi et al. [21], who found a median FA% of 1.58% on the first day of admission. On day 3, the medians remained below the 10% threshold recommended to avoid adverse outcomes [22, 23]. By day 10, even among patients who remained hospitalized, the medians also stayed below 10%, suggesting adequate control of FA progression. Taken together, the findings from both the univariate and multivariable binary logistic regression analyses indicate that FA is not associated with isolated risk factors, but likely results from multifactorial interactions among complex clinical conditions, such as nutritional and infectious status, that are not fully captured by unidimensional analyses.
ROSE phases
The analysis of fluid therapy management according to the ROSE concept in our cohort prospective demonstrates adherence to literature recommendations regarding phase duration, FA%, and metabolic parameters such as serum lactate. The Resuscitation phase had a short mean duration (2.7 hours), consistent with the need for rapid volume replacement to achieve hemodynamic stabilization, followed by an Optimization phase with a median duration of 15 hours, which aligns with the average duration of 29.2 hours reported by Lucas et al. [24]. The Stabilization and Evacuation phases were longer, with median durations of 72 and 144 hours, respectively, reflecting the time required for maintenance and removal of excess fluid. The Evacuation phase was significantly longer in the prospective cohort (P = 0.020), suggesting that the application of the ROSE concept may have encouraged a more conservative and prolonged approach to fluid removal, which could be beneficial in patients at risk for increased GIPS.
Trajectories
Regarding FA% at the end of each ROSE phase in our cohort prospective, the median was 4.7% during resuscitation and 4.2% during optimization, both below the threshold considered critical in the literature (≥ 5%) [22]. In the Stabilization phase, the median remained at 4.2%, still within safe parameters, followed by a reduction to 2.4% during the Evacuation phase, indicating successful fluid removal strategies and prevention of FA. These findings reflect a careful management approach that avoided excessive FA, which could negatively impact clinical outcomes. Lactate values also followed the expected trend, with higher levels during the Resuscitation phase, indicating initial hypoperfusion, followed by a progressive decrease until normalization in the Evacuation phase. The significant reduction in lactate during the Optimization phase in the prospective group (P = 0.001) is an important finding, as it suggests improved tissue perfusion and treatment response after implementation of the ROSE concept. This trend suggests adequate reversal of tissue hypoperfusion and supports the timing of transitions between fluid management phases [25].
Fluid management
The data observed in our prospective study demonstrated adherence to fluid management guidelines based on the ROSE concept, with fluid therapy and de-resuscitation strategies adjusted according to each patient’s clinical phase. During the Resuscitation phase, there was high use of crystalloids, a practice consistent with recommendations for restoring tissue perfusion in shock scenarios [1]. The use of blood products and albumin reflects the clinical severity of the cases and follows specific indications described in the literature [26, 27]. In the Optimization phase, fluid administration decreased, while the use of diuretics and albumin increased, in line with efforts to achieve hemodynamic stability with lower risk of FO [26]. In the Stabilization phase, fluid restriction strategies predominated, with reduced use of crystalloids and increased use of furosemide and RRT [25]. Finally, in the Evacuation phase, the focus on fluid removal was evident, with diuretics used in more than half of the patients and RRT maintained in 10.2%, consistent with recent studies that highlight the clinical benefits of conservative fluid and de-resuscitation strategies for patients who do not progress to spontaneous fluid offloading [7]. The findings in the retrospective cohort were consistent with those of the prospective cohort, demonstrating the adequacy of fluid management practices in our service.
Secondary outcomes
The clinical outcomes observed in this prospective study also align with current literature on fluid therapy within the ROSE framework. The mean duration of IMV and mean PICU length of stay reflect the clinical complexity of the patients and the importance of intensive care. Studies such as the meta-analysis by Bednarczyk et al. [28] and the cohort study by Douglas et al. [29] have shown that resuscitation strategies guided by dynamic assessment of fluid responsiveness are associated with reduced duration of IMV, lower need for RRT, and shorter PICU stays. Similarly, our study showed a progressive transition to conservative strategies during the Stabilization and Evacuation phases, with increased use of diuretics and RRT, consistent with the findings of the meta-analysis by Silversides et al. [30], which highlights the benefits of active de-resuscitation in increasing ventilator-free days and reducing ICU length of stay. The absence of significant differences across secondary outcomes – including duration of IMV, use of vasoactive amines, PICU length of stay, and need for RRT – supports the comparability of the retrospective and prospective cohorts.
Effect of education and training
In this study, similarities in clinical outcomes were observed between the retrospective and prospective groups, including length of PICU stay, duration of IMV, and need for RRT. These findings may be explained by the consistent adherence to FA% targets across the phases of the ROSE concept in both cohorts. Across both study phases, FA% values remained consistently below thresholds associated with adverse outcomes, reflecting a baseline adherence to good fluid stewardship practices. This likely limited the magnitude of observable differences after ROSE implementation and may explain the similarity in most clinical outcomes. In contrast, after team education and training, overall adherence to FA% targets increased, particularly during the Evacuation phase, which aligns with the trajectory of CFB, showing a higher number of patients achieving FE in the prospective group. The article aligns with recognized understanding from other pediatric fluid studies emphasizing phases of fluid therapy and avoiding deleterious FA above 10% for improved clinical outcomes [22, 23]. The ROSE concept, though widely used in adult critical care, had not been formally validated in pediatrics – this study pioneers its systematic application and analysis in this population. The findings support prior evidence that meticulous fluid management – including early resuscitation with crystalloids, subsequent optimization with albumin and diuretics, and eventual deresuscitation with furosemide and RRT – can contribute to better control of FA and potentially improved outcomes [31]. Clinical outcomes reported here, including ventilator duration and PICU stay, are consistent with meta-analyses and systematic reviews suggesting that fluid stewardship and individualized phase-based fluid therapy reduce morbidity [23, 31]. The inclusion of lactate trends as a marker of tissue perfusion and phase transition strengthens the clinical relevance of the ROSE framework.
LIMITATIONS
This study has some limitations. The first concerns the statistical power. The sample size calculation assumed a moderate effect size, but the observed effect was smaller, increasing the likelihood of a Type II error; therefore, the present study may have been underpowered to detect small differences. Several P-values were close to 1.00, suggesting no detectable differences, which may also be related to sample size limitations. Second, the small sample size and single-center design may limit the generalizability of the findings. Third, the pre-ROSE phase relied on retrospective data, which may be subject to collection bias. The lower mortality observed in the prospective group is attributable to the fact that most patients who progressed to death during this phase did not have sufficient time for the informed consent process to be completed. Fifth, the lack of detailed hemodynamic monitoring and fluid responsiveness markers may have limited the accuracy of phase identification and fluid management strategies. Sixth, the inability to retrieve detailed fluid volumes from the retrospective phase represents a significant limitation. This limitation may have affected the precision of FA% calculations and potentially influenced the fidelity of ROSE phase classification, particularly in borderline clinical scenarios. Seventh, clinicians were aware of the ROSE framework and of being observed during the prospective phase, which may have influenced clinical behavior and introduced performance bias. Finally, larger prospective, multicenter studies in ROSEnaïve centers are warranted to validate and refine the proposed model. On the other hand, the data presented here contribute to the literature, suggesting that the ROSE model may be a promising strategy for individualizing pediatric fluid therapy.
CONCLUSIONS
The implementation of the ROSE framework in pediatric fluid management was feasible and provided a structured approach for monitoring and benchmarking fluid accumulation across distinct phases of critical illness. Although major clinical outcomes were similar between study phases, adherence to FA% targets improved after structured team education, particularly during the Evacuation phase. Key lessons learned include the importance of phase-aware fluid stewardship, early recognition of fluid accumulation, and timely transition to deresuscitation strategies. While ROSE implementation did not directly modify daily protocols, it reinforced a shared clinical language and supported individualized fluid decision-making. Validation in larger, multicenter, ROSE-naïve pediatric cohorts is warranted.