
The use of a reduced tidal volume (VT), in combination with alveolar recruitment manoeuvres (ARMs) and an individualised positive end-expiratory pressure (PEEP), constitutes the basis of lung protective ventilation (LPV) [1]. An adaptation of this strategy, the tailored open lung approach (tOLA), integrates systematic ARMs and the application of an optimal individualised PEEP (PEEPOP), the lowest PEEP that prevents de-recruitment while avoiding lung overdistention [2]. The tOLA is designed to minimise lung collapse and alveolar hyperinflation, reduce atelectrauma, and improve oxygenation while diminishing lung stress through reduction of driving pressure (Pdriv) [3, 4]. The benefits of achieving adequate ventilation at the minimum Pdriv have recently been recognised in both surgical [5, 6] and critical care patients [7]. However, the practice of lung “opening” may induce undesirable effects. There is debate concerning the potential increase in the physiologic dead space (VDphys) following manoeuvres aimed at preventing lung collapse [3, 8–13]. Few studies have shown that escalating PEEP in the distressed lungs of both animals and humans correlates with an increase in the VDphys, including its airway (VDaw) and alveolar (VDalv) components [8, 9], particularly when it coincides with higher Pdriv. Conversely, the use of ARMs, either in isolation or as part of a tOLA, has been associated with a reduction in VDphys [3, 10] and notably VDalv [3, 11]. The duration of the end inspiratory pause (EIP) is postulated to be a modifiable ventilatory variable capable of improving alveolar ventilation and enhancing gas exchange in surgical and intensive care patients [12–19]. We recently demonstrated the benefits of extending EIP while ventilating patients with a tOLA [20]. Implementing an EIP of 30% vs. 10% was associated with a lower Pdriv and a higher static respiratory system compliance (CRS) under both standard LPV and tOLA protocols, allowing for the reduction of PEEP with the latter approach [20]. Considering the potential advantages of enhanced EIP for ventilatory efficiency, characterised by a reduction in the VDphys within its components, VDaw and VDalv, we aimed to investigate the impact of modifying the EIP on patients ventilated under tOLA. A prospective-paired study was designed to evaluate the effects of three different EIP levels (10%, 30%, and 40%) on ventilatory efficiency and respiratory mechanics in patients undergoing prostatic robotic surgery under tOLA, with a particular focus on the effects of pneumoperitoneum and a steep (40°) Trendelenburg position.
METHODS
This prospective-paired clinical trial was approved by the local Ethical Committee (chairperson Dr Víctor Sánchez Margalet; acta CEI_06/2022; date of approval 23/06/2022) and was registered at http://www.clinicaltrials.gov (NCT05514366). Written informed consent was obtained from all subjects participating in the trial.
The study was carried out at a tertiary care teaching hospital. Adult males (≥ 18 years) scheduled for robotic prostate surgery at our institution were consecutively recruited between January and May 2023. The recruitment of subjects was dependent on the availability of the investigators. The exclusion criteria included enrolment in other intervention studies, an inability to understand the information contained in the informed consent leaflet, an ASA (American Society of Anesthesiologists) physical status classification > 3, end-stage kidney disease, chronic obstructive pulmonary disease with a Global Initiative for Chronic Obstructive Lung Disease (GOLD) grade ≥ 3, forced vital capacity < 60% or > 120% of the predicted value (all candidates underwent preoperative forced spirometry), a body mass index ≥ 35 kg m–2, a New York Heart Association functional classification ≥ 3, clinical suspicion of heart failure, preoperative use of ionotropic agents, presumed or confirmed intracranial hyper-tension, evidence of pneumothorax or giant bullae on preoperative imaging if conducted, and SpO2 ≤ 97% while breathing room air in a supine position.
Outcomes
The primary outcome assessed was the effect of varying EIP on the ventilatory efficiency, estimated through the variations in the components of VDphys, including VDalv and VDaw, prior to (stage 1) and after pneumoperitoneum and Trendelenburg (stage 2). Secondary outcomes involved the examination of how different EIPs affected the ratios of VDaw/VT, VDalv/VT, VDphys/VT, as well as alveolar tidal volume (VTalv), the tidal elimination of CO2 (VTCO2), and the CRS, Pdriv, plateau pressure (Pplat), and peak pressure (Ppeak) during the two specified stages.
Study protocol
The approach to anaesthetic management was standardised. Upon arrival at the theatre, patients underwent continuous monitoring, which included a 5-lead electrocardiogram, pulse oximetry, and non-invasive blood pressure measurements. Initial sedation was achieved with 1–2 mg of midazolam, followed by remifentanil infusion at a rate of 0.03–0.05 μg kg–1 of predicted body weight (PBW) min–1. The left radial artery was catheterized under local anaesthesia. Participants were pre-oxygenated using a facial mask for 5 minutes on spontaneous ventilation with an FiO2 of 0.8 prior to induction with propofol (1–1.5 mg kg–1 PBW). Rocuronium at a dose of 0.8 mg kg–1 PBW was administered to facilitate tracheal intubation. Ventilation was conducted via a Primus Anesthesia Workstation (Drager, Germany), using a VT of 8 mL kg–1 PBW. The ventilatory settings were as follows: volume-controlled ventilation with an inspiration: expiration ratio of 1 : 2 and a respiratory rate of 12–15 breaths per minute to maintain the end-tidal CO2 pressure within 35 ± 5 mmHg (4.7 ± 0.7 kPa) and PEEP at 5 cmH2O (0.5 kPa). An initial EIP of 30% was programmed for all patients. A fresh gas flow of 0.5–1 L min–1 with an FiO2 of 0.6 was maintained throughout the procedure. Anaesthesia was sustained with remifentanil at a rate of 0.03–0.05 μg kg–1 (PBW) min–1 and sevoflurane at 0.6–0.8 of the age-adjusted minimum alveolar concentration, ensuring that the bispectral index remained between 40 and 60 (BIS Quatro; Covidien LLC, Singapore). Neuromuscular relaxation was assessed using train of four monitoring (TOF-watch; Organon Ltd., Ireland), with rocuronium administered as necessary to achieve a deep to intense blockade (TOF count = 0). Ventilation parameters remained constant throughout the study, except for PEEP, adjusted based on tOLA ventilation principles [2], and EIP, modified according to the study protocol. Volumetric capnography was conducted using the FluxMed monitor (MBMED, Argentina). Expired CO2 levels were measured with a mainstream sensor (Capnostat 5, Zoll Medical, US), positioned along with the FluxMed flow sensor between the Y-piece and the endotracheal tube, distal to the electrostatic filter HME (Covidien, Ireland). Calibration of this setup was performed as per manufacturer guidelines. The data were transferred in real time to a laptop equipped with FluxView-FluxReview software (MBMED, Argentina), enabling automatic logging of parameters such as VDalv, VDaw, VDphys, and their ratios to VT, calculated with the Bohr equation. The FluxMed system also recorded VTCO2 and respiratory mechanics data. A comprehensive account of volumetric capnography, including parameters recorded and calculated by the FluxMed system, is detailed elsewhere [21]. Continuous monitoring of Ppeak, Pplat, PEEP, CRS, FiO2, and end-tidal CO2 (ETCO2) was conducted using the anaesthesia workstation. Pplat was displayed at the end of the programmed pause, when inspiratory flow had returned to zero. Under these conditions, the measured Pplat, and derived compliance reflect static respiratory system mechanics. The Primus workstation automatically provided the required ventilatory data (exhaled VT, Pplat, and PEEP), enabling automatic real-time estimation of CRS without external instrumentation or manual intervention, using the formula: CRS = VT/(Pplat – PEEP). No additional manual inspiratory or expiratory hold manoeuvres were required. Gas analyses were performed with an ABL90 FLEX PLUS device (Radiometer Medical, Spain).
FIGURE 1
Study sequence. Stage 1, before pneumoperitoneum and Trendelenburg, included times 0 to 4. Stage 2, after pneumoperitoneum and Trendelenburg, included times 5 to 8
ARM – alveolar recruitment manoeuvre, CRS – static respiratory compliance, EIP – end inspiratory pause, Pdriv – driving pressure, PEEP – positive end-expiratory pressure, PEEPOL – open-lung PEEP
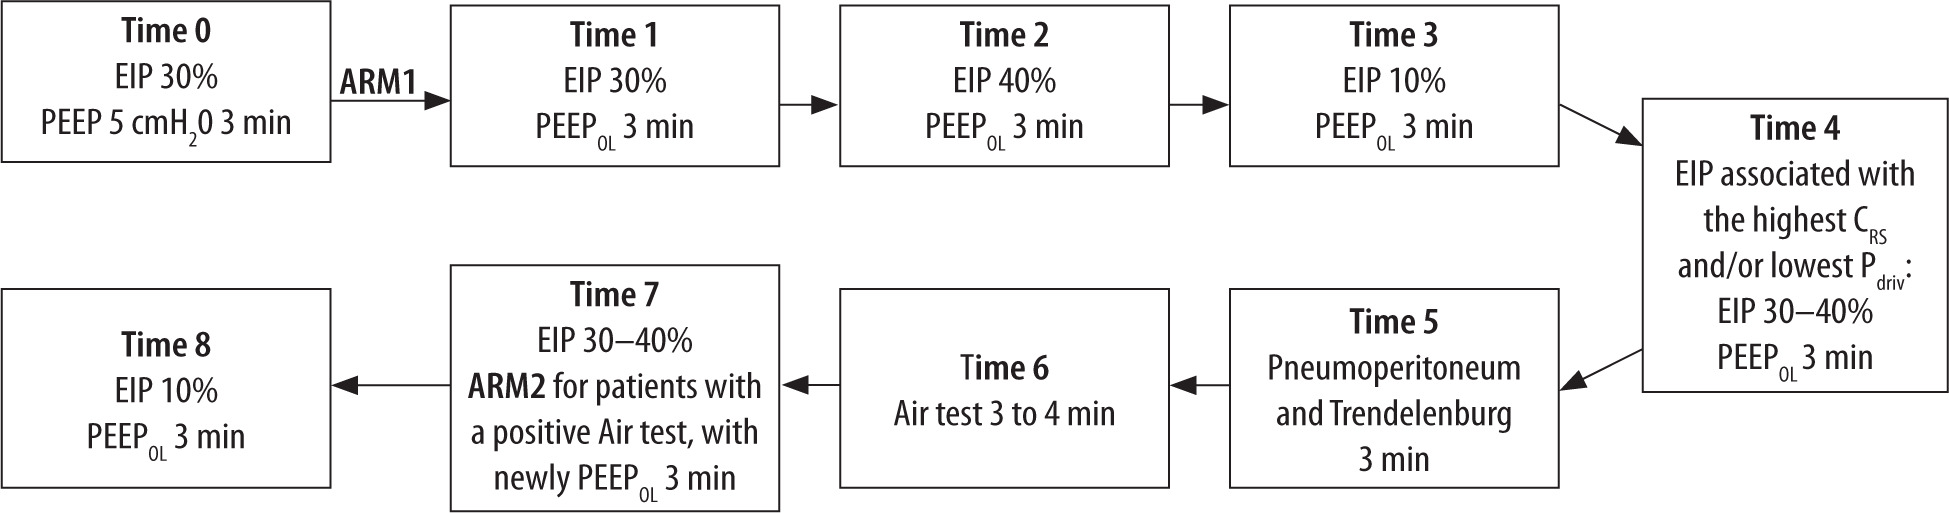
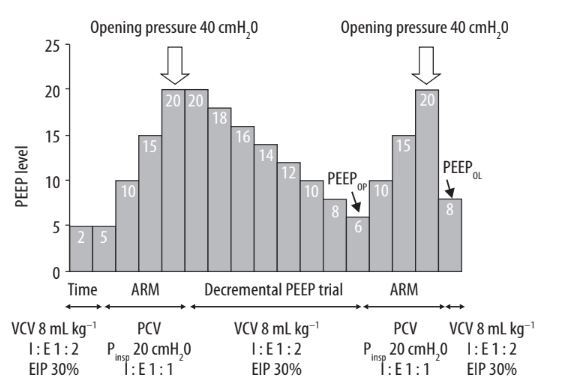
FIGURE 2
Example of PEEP settings during an alveolar recruitment manoeuvre and decremental PEEP trial in a patient with an estimated PEEPOP of 6 cmH2O. Note that PEEPOL is set at 2 cmH2O above the PEEPOP
ARM – alveolar recruitment manoeuvre, EIP – end-inspiratory pause, PCV – pressure-controlled ventilation, PEEP – positive end-expiratory pressure, PEEPOP – optimal PEEP, PEEPOL – open lung PEEP, Pinsp – inspiratory pressure, VCV – volume-controlled ventilation
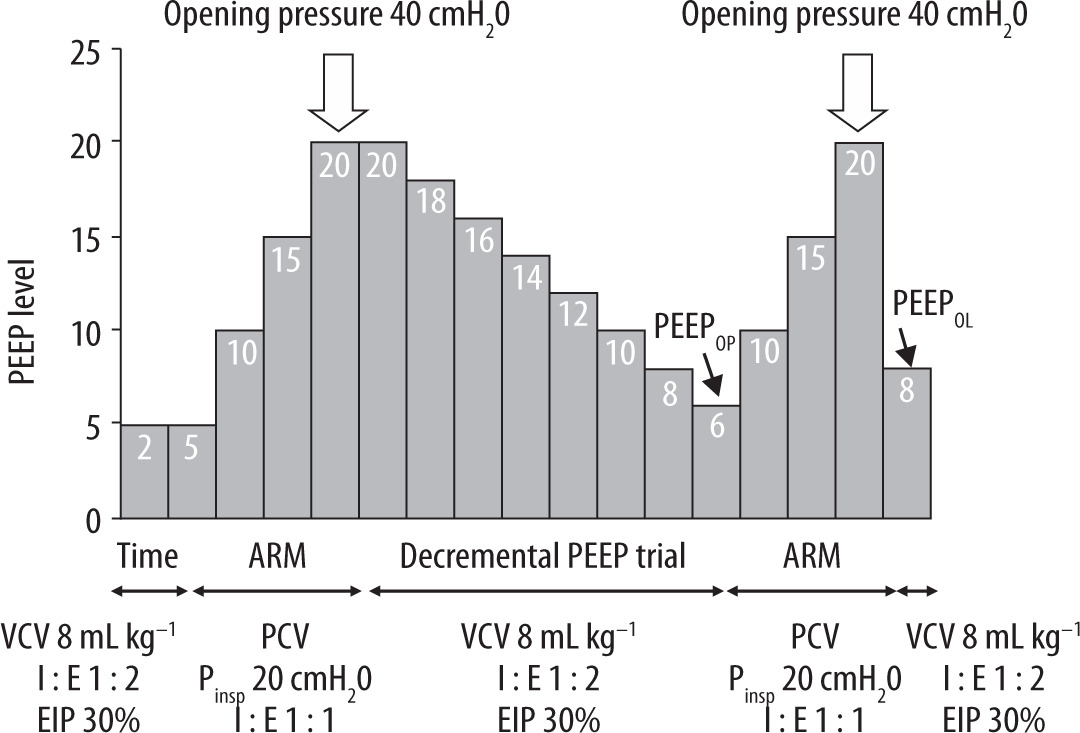
The study sequence is described in Figure 1. Stage 1, occurring before pneumoperitoneum and Trendelenburg, included the following time points: Time 0, which was after endotracheal intubation, using standard LPV settings with an EIP at 30%, a PEEP of 5 cmH2O (0.5 KPa), and prior to ARM application; Time 1, following an ARM (ARM1), described in Figure 2 and detailed elsewhere [2, 20]. This ARM was performed in pressure-controlled mode and consisted of three stepwise increases in PEEP and inspiratory pressure (Pinsp), starting at a PEEP of 5 cmH2O (0.5 kPa). Pinsp was maintained at 20 cmH2O (2 kPa) above PEEP throughout the manoeuvre. Both PEEP and Pinsp were increased by 5 cmH2O (0.5 kPa) per step, resulting in a maximum PEEP of 20 cmH2O (2 kPa) and a corresponding airway opening pressure of 40 cmH2O (4 kPa). Each step comprised five consecutive ventilation cycles at the corresponding Pinsp and PEEP levels before progressing to the next step. The number of steps and the 20 cmH2O (2 kPa) pressure differential were standardized across all patients as predefined in the study protocol. Ventilation was then switched back to volume-controlled mode with the same parameters as at Time 0 but with a PEEP of 20 cmH2O (2 kPa). At this stage, the optimal PEEP (PEEPOP) – the one associated with the highest CRS – was titrated through a decremental PEEP trial, starting at 20 cmH2O (2 kPa) and decreasing by 2 cm H2O (0.2 kPa) with each step, with each PEEP level maintained for thirty seconds. Upon reaching a PEEP level 2 cmH2O (0.2 kPa) below PEEPOP, where CRS began to decline due to the reappearance of alveolar collapse, a new ARM was performed to re-expand any potentially derecruited alveolar units. A final open-lung PEEP (PEEPOL) was then set at 2 cmH2O (0.2 kPa) above the PEEPOP [2, 22]. If mean arterial pressure (MAP) decreased by more than 25% during the recruitment phase, the procedure was paused, and 6–12 mg of ephedrine or 0.05–0.15 mg of phenylephrine was administered. The manoeuvre was resumed once haemodynamic stability was restored. Times 2 and 3 involved adjusting the EIP to 40 and 10%, respectively; Time 4 entailed selecting the EIP that resulted in the highest CRS and/or lowest Pdriv. Stage 2 included Time 5, marking the establishment of pneumoperitoneum and Trendelenburg; Time 6, during which a SpO2-FiO2 test (Air test) was performed to detect lung collapse, as detailed elsewhere [10]. Briefly, a reduction in SpO2 below 97% after 3 to 4 minutes on an FiO2 of 0.21 (or higher) during a decremental FiO2 test (indicative of a positive Air test) led to the assumption of significant shunting (> 10%) secondary to lung collapse; at Time 7, a new ARM (ARM2) was performed for patients with a positive Air test, involving the application of a newly tailored PEEPOL. This second ARM was conducted following the same stepwise protocol as ARM1 but starting from the patient’s individualized PEEPOL at that time point [22]. The EIP was set between 30% and 40%, based on the decision made at Time 5; at Time 8, the EIP was adjusted to 10%, marking the end of the study period. Data collection occurred at Times 0–3, 5, and 7–8, and arterial blood gases were recorded at Times 0, 1, and 5.
TABLE 1
Demographic data, comorbidities, and ventilation parameters throughout the study
Statistical analysis
The original sample size estimation was based on a difference in CRS, reported in our prior crossover study on EIP under a tOLA strategy [20]. Using EPIDAT 4.2 (Galician Health Council), we calculated that 17 patients would provide 80% power to detect a 17 mL cmH2O–1 difference in CRS (30% vs. 10% EIP), with a 5% significance level and 20% dropout allowance. However, as the primary outcome in the present study was Vdphys – without prior data available under tOLA – we performed a subsequent internal validation using G*Power 3.1.9.7 (Heinrich Heine University) and preliminary data from the first six patients. This re-estimation, based on an observed 15 mL difference in VDphys between EIP 30% and 10%, employed a two-tailed paired Student’s t-test, with 80% power, a one-sided α error of 5%, and a 20% anticipated dropout rate. The results confirmed the adequacy of the originally planned sample size.
For data analysis, we employed IBM SPSS Statistics for Windows, version 24 (IBM Corp., US). Analysis of continuous variables involved the use of mean (SD) and median (IQR). We assessed the normality of distribution with the Shapiro-Wilk test. To examine the behaviour of continuous variables over the course of the study, we used either repeated measures ANOVA or the Friedman test based on the distribution characteristics of the data. For post hoc comparisons between time points, we applied Bonferroni correction to adjust for multiple comparisons.
RESULTS
A total of 21 subjects were enrolled in the study, among whom three were excluded: two for presenting a GOLD class 3 on preoperative spirometry and one owing to a failure in data recording with the computer. Patient characteristics are summarised in Table 1. Tables 2 and 3, and Figures 3 and 4 present the results of the study at stages 1 and 2. Table 4 provides the data for the subset of patients who required recruitment at stage 2 because of a positive Air test (n = 12).
The use of an EIP of 10% compared with 30–40% resulted in increased VDaw, VDphys and VDphys/VT, along with a decrease in VTalv (EIP 10% vs. 40%) during stage 1 (Tables 2 and 3, and Figure 3). The increase of VDphys associated with the EIP 10% remained consistent after establishing pneumoperitoneum and Trendelenburg positioning (stage 2). We observed improvements in lung mechanics associated with the basal (Time 1) and subsequent post-Air test (Time 7) ARMs, along with the application of the corresponding tailored PEEPOL (Tables 2–4, and Figure 4). This was evidenced by an increase in CRS and a reduction in Pdriv, following the application of higher PEEP (and the expected rise in Pplat). No differences were observed in the ventilatory efficiency parameters following the ARMs, nor in the specific group of patients diagnosed with lung collapse based on the Air test (Table 4). In 10 patients, ARM1 was briefly suspended due to a MAP decrease requiring vasopressor therapy; after stabilization, the manoeuvre was completed in all cases. No MAP-related interruptions or pharmacological interventions were required during ARM2. Lastly, the use of an EIP of 10% during stage 1 led to a decrease in CRS (EIP 10% vs. 40%) along with an increase in Pdriv and Pplat (EIP 10% vs. 30%); the latter was also observed during stage 2 (Tables 2 and 3, and Figure 4).
TABLE 2
Modification of ventilatory parameters and dead volumes throughout stage 1, before pneumoperitoneum and Trendelenburg
[i] Airway pressure measurements are expressed in cmH2O, CRS is expressed in mL cmH2O–1, ETCO2 and arterial gases are expressed in mmHg, volume measurements are expressed in mL. VDphys/VT, VDaw/VT and VDalv/VT are presented as %. Variables are presented as median (Q1, Q3).
EIP – end inspiratory pause, Ppeak – peak pressure, Pplat – plateau pressure, PEEP – positive end-expiratory pressure, Pdriv – driving pressure, CRS – static compliance, ETCO2 – end-tidal CO2, VT – tidal volume, VTCO2 – tidal elimination of CO2, VDphys – physiologic dead space, VDaw – airway dead space, VDalv – alveolar dead space, VTalv – alveolar tidal volume
DISCUSSION
In this study, we conducted the first investigation into the effects of varying EIPs on ventilatory efficiency and respiratory mechanics in patients undergoing robotic surgery with a tOLA. Our results highlight several key aspects: 1) employing a shorter EIP (10% vs. 30–40%) impairs respiratory mechanics and ventilatory efficiency by increasing VDphys through expanding VDaw, both before and after the rise in intra-abdominal pressure; 2) the implementation of a tOLA, when combined with a constant EIP 30–40%, both before and during the establishment of pneumoperitoneum and Trendelenburg positioning, enhances respiratory mechanics without impacting ventilatory efficiency.
The beneficial effects of prolonging the EIP on ventilatory efficiency are thought to result from an increase in mean distribution time (MDT), which is the duration that inspired gas remains in the gas exchange region [19]. An extended MDT enhances CO2 elimination and reduces VDaw [19]. In our study, reducing the EIP to 10% was associated with an increase in VDaw and, consequently, in VDphys, while no differences were observed with EIPs of 30% and 40%. A recent study by Portela et al. [23], which investigated the effects of EIP 30% against a scenario of no EIP in horses ventilated with a PEEP of 5 cmH2O (0.5 kPa) without ARM, partially aligns with our findings. This study noted an augmentation in VTalv and VTCO2, a decrease in VDaw, and no change in VDalv, thus corroborating the independent impact of EIP 30% on ventilatory efficiency.
TABLE 3
Modification of ventilatory parameters and dead volumes throughout stage 2, following pneumoperitoneum and Trendelenburg
FIGURE 3
Dead volumes and VTalv modifications throughout the study period. Volume measurements are expressed in ml. *P < 0.05 in paired comparisons using Bonferroni correction for multiple comparisons
Time 0 – end inspiratory pause (EIP) 30% and PEEP of 5 cmH2O, Time 1 – EIP 30% following alveolar recruitment manoeuvre (ARM1) and open-lung PEEP (PEEPOL), Time 3 – EIP 10%, Time 5 – EIP 30% following pneumoperitoneum and Trendelenburg, Time 7 – EIP 30% following ARM2, Time 8 – EIP 10%, VDaw – airway dead space, VDphys – physiological dead space, VTalv – alveolar tidal volume
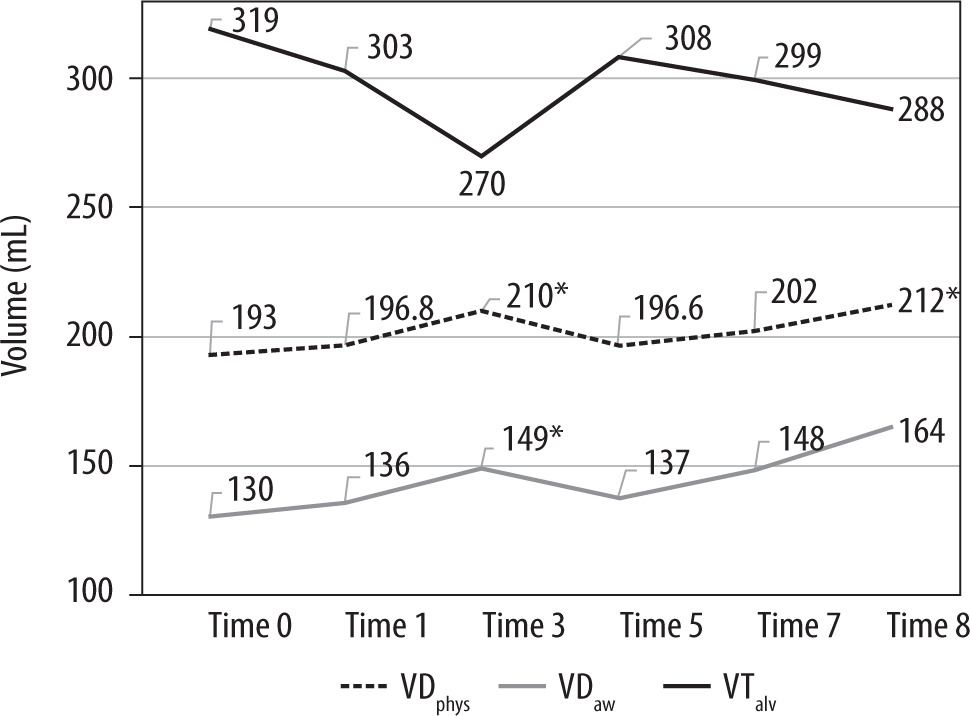
FIGURE 4
Respiratory mechanics throughout the study period. Airway pressure measurements are expressed in cm H2O. *P < 0.05 in paired comparisons using Bonferroni correction for multiple comparisons
Pdriv – driving pressure, PEEP – positive end-expiratory pressure, Pplat – plateau pressure, Time 0 – end inspiratory pause (EIP) 30% and PEEP of 5 cmH2O, Time 1 – EIP 30% following alveolar recruitment manoeuvre (ARM1) and open-lung PEEP (PEEPOL), Time 3 – EIP 10%, Time 5 – EIP 30% following pneumoperitoneum and Trendelenburg, Time 7 – EIP 30% following ARM2, Time 8 – EIP 10%
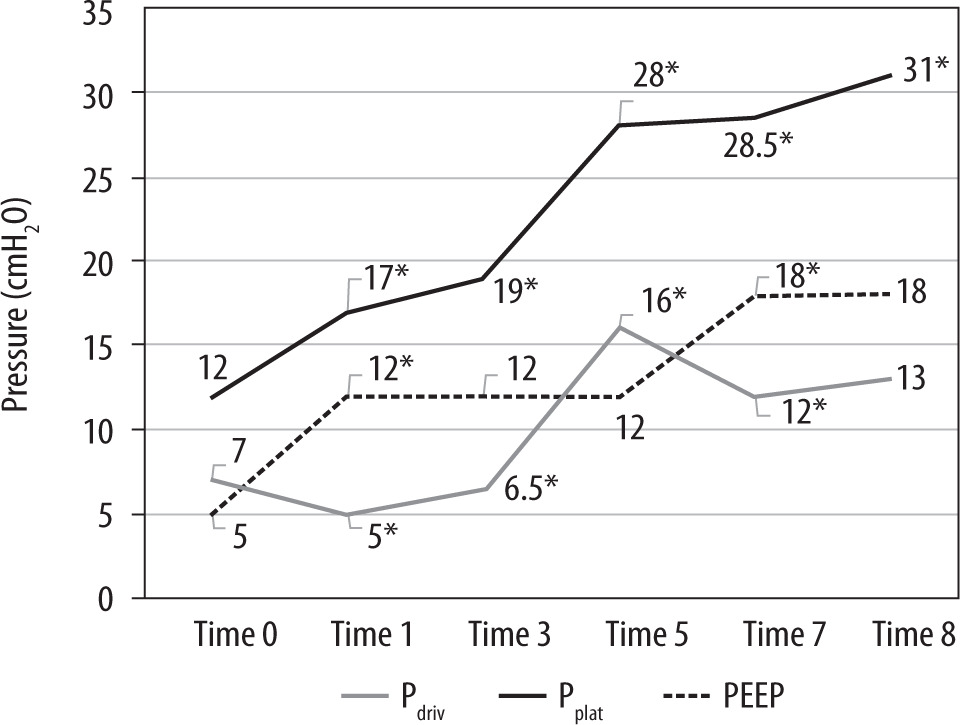
TABLE 4
Modification of ventilatory parameters and dead volumes throughout stage 2 in subjects with a positive Air test undergoing a second ARM (n = 12)
[i] Variables are presented as median (Q1, Q3). Airway pressure measurements are expressed in cm H2O; CRS is expressed in ml/cm H2O; ETCO2 and arterial gases are expressed in mmHg; volume measurements are expressed in ml.
ARM – alveolar recruitment manoeuvre, EIP – end inspiratory pause, Ppeak – peak pressure, Pplat – plateau pressure, PEEP – positive end-expiratory pressure, Pdriv – driving pressure, CRS – static compliance, ETCO2 – end-tidal CO2, VT – tidal volume, VTCO2 – tidal elimination of CO2, VDphys – physiologic dead space, VDaw – airway dead space, VDalv – alveolar dead space, VTalv – alveolar tidal volume
The clinical benefits of applying a prolonged EIP for patients ventilated with tOLA require further validation. However, this remains an intriguing area of study, particularly in situations where cumulative small improvements could yield significant clinical impact. Robotic surgery – particularly in specific populations such as obese patients – may represent one such scenario. Additionally, patients with acute respiratory distress syndrome could also benefit, as low VT ventilation in this group may lead to hypercapnia and reductions in both VTalv and VTCO2. The study by Aguirre-Bermeo et al. [14] demonstrated that prolonging the EIP in ARDS patients, without using ARM, reduced VDphys and PaCO2 levels. This allowed for a further decrease in VT, helping to prevent overdistension. In examining the application of ARM and tailored PEEP, our findings align with those of Tusman et al. [10], who reported their observations in morbidly obese patients undergoing bariatric surgery with pneumoperitoneum. These patients, ventilated with a baseline PEEP of 8 cmH2O (0.8 kPa) and without EIP, showed no significant changes in VDphys or VTCO2 after implementing an ARM using a median PEEP of 16 cmH2O (1.6 kPa). In contrast, Ferrando et al. [3] reported a significant reduction in VDaw and VDalv after applying ARM and tOLA in patients ventilated with an EIP of 10% and a baseline PEEP of 5 cmH2O. Previous researchers have suggested that an individualised and optimised open lung approach could diminish lung inhomogeneities, potentially enhancing lung efficiency by reducing overdistension in small conducting airways and alveoli, consequently decreasing VDaw and VDalv [3]. Our data do not seem to corroborate this hypothesis, but some clarification is required. The absence of a notable reduction in VDphys following the initial ARM and tOLA in our study may be partially attributed to potential over-distension in some of our patients. Implementing a tOLA technique [2], we set the PEEPOL 2 cmH2O (0.2 kPa) above the PEEPOP, resulting in slightly higher PEEP levels than those used by Ferrando et al. [3]. In line with our findings, Tusman et al. [9] observed that applying a PEEP of 20 cmH2O to the distressed lungs of Landrace pigs ensured the lowest Pdriv but also resulted in a significantly higher VDaw and VDalv when compared with lower levels of PEEP. Interestingly, these lower PEEP levels allowed a positive expiratory transpulmonary pressure which presumably prevented lung collapse during expiration and facilitated the attainment of peak VTCO2 [9]. This leads us to speculate that excessive PEEP levels, while recognised as suitable for maintaining lung openness, might be deleterious in terms of ventilatory efficiency through an overdistension phenomenon [4]. This raises the question of whether using a PEEPOL higher than PEEPOP increases the risk of potential ventilatory inefficiency, a topic that warrants further investigation. Similarly, the systematic use of ARM, is currently a subject of debate, considering that some patients may not require recruitment if they do not experience a significant degree of lung collapse [22]. In this context, the use of the Air test to identify lung collapse has been proposed as a feasible bedside monitoring tool to help identify patients who may benefit from an ARM [22]. In our study, we observed that patients who underwent a second ARM guided by the Air test showed improved ventilatory mechanics without adverse effects on ventilatory efficiency or haemodynamic stability. Notably, no MAP-related interruptions were observed during ARM2, suggesting improved haemodynamic tolerance. While not a predefined objective of this study, this finding may be partially explained by the shorter manoeuvre duration – given that ARM2 was initiated from a higher baseline PEEP (PEEPOL) – and by physiologic adaptation to prior pneumoperitoneum and Trendelenburg positioning. These factors may have attenuated the acute circulatory response to the manoeuvre and lend support to proposals advocating for a tailor ed ARM strategy [22]. Finally, and although the present study was not specifically designed to explore the resistive and elastic determinants of airway pressure, we believe it is relevant to offer some clarification regarding the potential impact of reduced inspiratory flow time – associated with longer end-inspiratory pauses – on Ppeak. While Ppeak values tended to be slightly higher with prolonged EIP (30–40%) compared to short EIP (10%), these differences were not statistically significant at most time points, findings that are consistent with previous studies [20, 24]. A likely explanation lies in the compensatory interaction between the resistive (flow-related) and elastic (compliance-related) components of airway pressure. Supporting this interpretation, we observed that at time points where static compliance (CRS) was significantly higher with prolonged EIP, Ppeak remained unchanged, suggesting that improved compliance may have offset the increased resistive pressure resulting from higher inspiratory flow rates, a question that may warrant further exploration in targeted studies.
Limitations
Our study has several limitations. First, it is restricted to adult males undergoing robotic prostate surgery, which may limit its applicability to other populations. Second, the sample size was determined based on our primary variable and may not be sufficient for all analyses in the study. The absence of evidence for increased effective alveolar ventilation, as indicated by a rise in VTCO2 associated with prolonged EIP, may stem from this limitation, highlighting the need for further studies to explore this question in greater depth. A major limitation of the present study is the absence of clinical outcome data. Although the physiological advantages of a prolonged EIP under a tOLA strategy are supported by our results, the actual impact on relevant clinical endpoints remains unknown. Therefore, our findings should be interpreted with caution, and further studies specifically designed to evaluate clinical outcomes are needed to confirm the utility of this approach in routine perioperative care. Another limitation was the lack of arterial blood gas assessments throughout the entire study period, which restricted our ability to analyse its alterations in conjunction with EIP changes, an aspect explored in our previous research [20]. Additionally, lung collapse was evaluated using the Air test [25]. Given the Air test’s reported sensitivity and specificity of 82.6% and 87.8%, respectively, compared with CT images [25], and 65% and 94%, respectively, compared with CRS in morbidly obese patients undergoing bariatric surgery [10], there is a possibility that we mismanaged a substantial number of participants by inappropriately applying or withholding ARMs, thereby introducing a confounding factor in our assessment of the tOLA strategy’s impact on ventilation efficiency. Regrettably, integrating radiologic imaging or oesophageal pressure measurement into routine surgical patient care remains a challenge, complicating the resolution of this issue in practical settings. A notable methodological consideration is the mid-study re-estimation of sample size. Although the original calculation based on CRS was prospectively registered and approved, we later reassessed sample adequacy using VDphys data from the first six participants, given the lack of published tOLA-specific data at the time of protocol design. The re-estimation confirmed the appropriateness of the original target and did not alter the study design, endpoints, or recruitment targets. Nonetheless, we acknowledge that this adjustment was not pre-specified in the trial registry or ethics submission and have now addressed this issue through formal updates. In addition, a substantial portion of the cited literature originates from our own research group or closely affiliated collaborators. While this reflects the limited number of studies on this specific ventilatory strategy in the surgical setting, it may introduce citation bias and limit generalizability. To mitigate this, we reduced non-essential internal citations and emphasize the need for external validation by independent research teams.
Finally, the study followed a fixed sequence in which measurements with a prolonged EIP (30–40%) preceded those with a shorter EIP (10%). As a result, potential carry-over effects cannot be excluded. Since the short EIP condition was assessed after lung recruitment and ventilation with a longer EIP, any residual benefits from the initial optimized state may have attenuated the differences observed. A randomized crossover design (30 → 10 vs. 10 → 30) might have revealed an even greater relative benefit of prolonging the EIP. Future studies should consider incorporating sequence randomization to account for this potential confounder.
CONCLUSIONS
Our study demonstrates that employing an EIP of 30–40% during ventilation of patients with healthy lungs undergoing robotic surgery facilitates optimal conditions by minimising lung stress and ventilation inefficiencies. Future research should investigate whether the use of a PEEPOP could enhance ventilation efficiency in comparison to a higher PEEPOL.