
Patient satisfaction is one of the major markers of quality in healthcare. Hospital leaders, department chairs, and insurance companies use results from patient satisfaction surveys to guide decisions with respect to quality improvement initiatives, salary incentives, and reimbursements. Various stakeholders – including physicians, nurses, and other healthcare professionals – have developed surveys to evaluate patient satisfaction over the years. With the development of those surveys, researchers in various disciplines have sought to describe factors associated with performance on the surveys in the hope of developing interventions to improve quality of care, make healthcare more patient-centered, and change clinician practices and behaviors [1–3].
While patient satisfaction in a wide range of disciplines has been well studied, the investigation of patient satisfaction with the anesthesia experience is still in its early stages. Several different survey instruments have been used to evaluate the anesthesia experience, each measuring different aspects of the patient’s care. For example, the Anesthesia Patient Satisfaction Questionnaire (based on recommendations from the American Society of Anesthesiologists [ASA]) can be used to study satisfaction with specific parts of the anesthesia experience (e.g. anxiety reduction, level of privacy). A recent study found that age ≥ 55 years, inpatient status, and nighttime surgery were associated with lower satisfaction scores in certain domains [4]. When using the Iowa Satisfaction with Anesthesia Scale, sex, ASA status, and education level were associated with changes in patient satisfaction scores [5]. Also complicating the matter, a variety of pharmacological and non-pharmacological factors have been implicated in affecting patient satisfaction. For example, the effect of preoperative intravenous midazolam on improving patient satisfaction with anesthesia has been inconsistent [6]. Similarly, the effect of music has also been inconsistent, highlighting the complexity of studying patient satisfaction with anesthesia [7–9].
The most common survey used to evaluate patient satisfaction is the Hospital Consumer Assessment of Healthcare Providers and Systems (commonly abbreviated as HCAHPS) survey, which was implemented by the Centers for Medicare & Medicaid Services in 2006 as the first publicly reported survey of the patient experience in the USA. While the survey measures several domains which are important to assess a patient’s experience with their care at the hospital, it does not make an assessment of the anesthesia experience. Nevertheless, Press Ganey, an independent company which administers HCAHPS surveys, offers the opportunity to add optional questions assessing satisfaction with the anesthesia experience, and thus facilitate measurement of patient satisfaction and report it to hospital administrators.
Although many studies have described predictors of patient satisfaction performance in surgical and other subspecialties on the HCAHPS survey administered by Press Ganey, predictors with the anesthesia-specific survey questions have not been described. Therefore, the aim of this study was to describe predictors associated with patient satisfaction as measured by the Press Ganey anesthesiarelated questions. We hypothesized that specific contextual factors would be associated with higher or lower satisfaction.
METHODS
We conducted a retrospective analysis of the patient experience with anesthesia at our institution, an urban, tertiary-care academic medical center that performs approximately 25,000 anesthetic procedures annually. The Institutional Review Board evaluated our protocol (#STUDY00001732) and determined that the proposed activity did not require informed consent. This study adhered to the Checklist for Reporting of Survey Studies (CROSS) guidelines (see Supplementary Figure 1).
HCAHPS surveys were administered by Press Ganey Associates, LLC (South Bend, Indiana, USA) within 1–2 weeks of discharge to 25% of all patients who underwent a surgical procedure at our institution. Surveys were completed at home by patients. Data were gathered and summarized by Press Ganey, and then sent to the medical center for review. Survey questions administered by Press Ganey have been previously found to have acceptable psychometric properties to reliably assess patient satisfaction, although limitations do exist [10]. Moreover, the survey has been established as an internally reliable survey, with a Cronbach’s a coef cient of 0.79 to 0.96 [10].
The patient satisfaction survey includes several standardized questions that assess a number of different domains (see Supplementary Figure 2). Complete information on its protocols and approaches can be found on the official HCAHPS website, www.hcahpsonline.org. At our request, Press Ganey added the following three optional (“custom”) questions to the surveys to measure the patient experience specifically with anesthesia:
rating of anesthesia services,
explanations provided by the anesthesiologists,
friendliness/courtesy of the anesthesiologist.
This study exclusively analyzed the results of these three anesthesia-related questions on the Press Ganey survey. Patients rated their satisfaction for each of the three questions on a Likert scale with 5 possible responses (very poor, poor, fair, good, and very good). The overall mean score for each question was calculated by first converting each of the responses to a numerical value (very poor = 0, poor = 25, fair = 50, good = 75, very good = 100), and then averaging the values for all the responses (for a possible range from 0–100). This process was performed by Press Ganey, such that the institution received the overall mean score. Our institution’s mean score for each question was then compared to the mean score of other institutions (which had a minimum of 30 responses for the question at hand) to determine our percentile rank, and reported by Press Ganey on a monthly basis.
For the purposes of this study, we also extracted ceiling rates. Ceiling rates are the percentage of responses that occur at the maximum value (in this case, a response of very good, which gives the maximum score of 100) [11]. Ceiling rates were considered high if ≥ 20% of the responses to a question were at the maximum score.
The primary outcome was the percentile rank of our institution compared to other institutions in the Press Ganey network on the anesthesia survey question “Rating of anesthesia services.” Secondary outcomes included the percentile rank on the other two anesthesia-related survey questions, “Explanations provided by the anesthesiologists” and “Friendliness/courtesy of the anesthesiologist.”
Covariates, which were evaluated as explanatory variables, included attending anesthesiologist work-load, number of comparator healthcare institutions, and season of year.
Attending anesthesiologist workload was defined as the mean number of cases per attending anesthesiologist per day, where a higher value indicated a higher workload. To calculate the workload, we determined the number of attending anesthesiologists working each workday (Monday–Friday, holidays excluded) and the number of surgical procedures each month. We then divided the number of surgical procedures each month by the number of workdays in each month (excluding weekends and holidays), and then divided by the number of attending anesthesiologists working each workday.
Number of comparator healthcare institutions was defined as the total number of institutions which reported responses to each particular patient satisfaction question. The number of comparator healthcare institutions could vary from question to question, because the anesthesia patient satisfaction questions are optional and therefore not all institutions report outcomes for each question. The monthly reports from Press Ganey outlined the number of comparator healthcare institutions for each question and were thus used as the source of these data. Because the Press Ganey percentile rank for any hospital is calculated relative to the performance of other hospitals, the number of comparator institutions can influence ranking independently of actual patient satisfaction. When fewer institutions contribute data, rankings become less stable, as small differences in mean scores can cause large percentile shifts. We therefore included the number of comparator institutions as a covariate to adjust for this variability and ensure that the observed effects reflect true differences in satisfaction.
Season of year (winter, spring, summer, and fall) was determined by examining in which month patients provided their survey responses to Press Ganey, and then assigning them accordingly (winter was defined as December, January, or February; spring was defined as March, April, or May; summer was defined as June, July, or August; and fall was defined as September, October, or November).
Patient satisfaction data were provided by Press Ganey. Anesthesia Touch (Plexus Technology Group, LLC, Jackson, Michigan, USA) is the anesthesia documentation software used at our institution; at the end of each month, data can be extracted from this software, and therefore it was used to determine the number of procedures each month. QGenda Advanced Scheduling (QGenda, LLC, Atlanta, Georgia, USA) – software used for anesthesia staff scheduling – was employed to determine the number of anesthesia providers working each month. Press Ganey also provided demographic data for the respondents.
To evaluate associations between the outcomes and covariates, we performed a linear regression analysis. For the primary outcome, percentile rank on the question “Rating of anesthesia services” was analyzed with attending anesthesiologist workload, number of comparator healthcare institutions, and season of year as explanatory variables. Univariable regression analyses were performed, followed by multivariable regression analysis. Results were presented as coefcients with corresponding 95% confidence intervals (CI) and P values. The same methodology was used for the secondary outcomes. We considered results statistically significant if the two-sided P value was < 0.05. Descriptive statistics were reported as n (%) or mean and standard deviation (SD) where appropriate. All analyses were performed using STATA v.16.1 (StataCorp, College Station, TX, USA).
RESULTS
Data were reviewed from December 1, 2016 to December 31, 2020, for a total of 49 calendar months. A total of 58,197 surgical procedures were performed in the main operating room suites during this time period, resulting in approximately 14,549 surveys sent by Press Ganey to patients to assess satisfaction using a simple random sampling method. A total of 3,218 (22.1%), 3,294 (22.6%), and 3,200 (22.0%) patients answered the “Rating of anesthesia services,” “Explanations provided by the anesthesiologists,” and “Friendliness/courtesy of the anesthesiologist” survey questions, respectively. The ceiling rates were 73.6%, 75.9%, and 76.2% for the “Rating of anesthesia services,” “Explanations provided by the anesthesiologists,” and “Friendliness/courtesy of the anesthesiologist” survey questions, respectively.
Demographic data were available for a total of 2,546 patients during the period October 1, 2017 to December 31, 2020; female patients represented 1,218 (47.8%) of the total sample. Mean (SD) age of the sample was 62.9 (2.1) years. The mean (SD) number of attending anesthesiologists working each day during the entire period was 14.4 (2.5), and the mean (SD) daily attending anesthesiologist workload was 4.1 (1.0) cases per attending anesthesiologist.
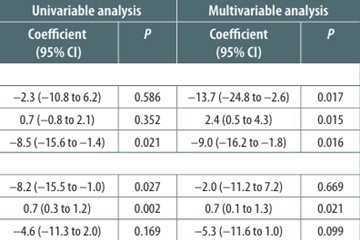
Results from univariable and multivariable regression analyses are presented in Table 1. We found on multivariable regression analysis that for the primary outcome (percentile rank on the question “Rating of anesthesia services”), greater attending anesthesiologist workload (–13.7; 95% CI: –24.8 to –2.6; P = 0.017) and season of year (–9.0; 95% CI: –16.2 to –1.8; P = 0.016) were associated with a lower percentile rank, while increasing number of comparator healthcare institutions was associated with a higher percentile rank (2.4; 95% CI: 0.5 to 4.3; P = 0.015). For the secondary outcome, “Explanations provided by the anesthesiologists,” multivariable regression analysis demonstrated that season of year was associated with a lower percentile rank (–5.3; 95% CI: –11.6 to 1.0; P = 0.099), though not significantly, while increasing number of comparator healthcare institutions was significantly associated with a higher percentile rank (0.7; 95% CI: 0.1 to 1.3; P = 0.021). For the secondary outcome, “Friendliness/courtesy of the Anesthesiologist,” multivariable regression analysis demonstrated that increasing number of comparator healthcare institutions was associated with a higher percentile rank (0.9; 95% CI: 0.2 to 1.5; P = 0.008).
TABLE 1
Regression analyses
DISCUSSION
In this study, we found that lower percentile rank with rating of anesthesia services was associated with greater attending anesthesiologist workload, season of year, and smaller number of comparator healthcare institutions (i.e. the question was not used by many institutions). We also found that lower percentile rank for explanations provided by the anesthesiologists was associated with season of year and fewer comparator healthcare institutions. Finally, we found that lower percentile rank with friendliness/courtesy of the anesthesiologist was also associated with smaller number of comparator healthcare institutions.
A very interesting finding of this study is the association between lower percentile rank with rating of anesthesia services and greater attending anesthesiologist workload. One possible explanation for this observation is that excessive workload is related to physician burnout, which in turn can negatively affect patient satisfaction. For example, anesthesia attendings and residents [12] as well as certified registered nurse anesthetists [13] are at greater risk for burnout when their work schedules involve long work hours and significant call burden. Several studies have further found that high levels of burnout are associated with lower patient satisfaction among both physicians [14] and nurses [15, 16]. Therefore, if a group of anesthesiologists (or likely any healthcare provider) hopes to improve their patient satisfaction scores, assessing and redistributing the workload and call burden of the group could prove to be an important approach. Additional strategies to mitigate decreases in patient satisfaction associated with higher anesthesiologist workload include optimizing the timing of add-on cases, expanding back-up coverage on high-volume days, and monitoring attending case complexity.
In recent years, there has been an emphasis in the medical literature on physician wellness, even going as far as stating that physician wellness should be a quality indicator because it can affect the care provided to patients [17]. However, in order to better address problems with physician wellness, an accurate measure of physician workload is needed. Work hours and overnight call burden are often used to measure physician workload, but what is diffe rent about our study is that we defined workload as the mean number of cases per attending anesthesiologist per day. We believe this is an important approach because the number of hours worked might not account for all the factors affecting stress asso ciated with the job. For example, the workload experienced by a physician may be different when performing a single 8-hour case compared to eight 1-hour cases, even though in both scenarios the number of hours may be the same. A similar metric is used in the nursing literature; nurse to patient ratios are used as a measure of nursing workload, and have been inversely associated with patient satisfaction [18, 19]. Our approach to measuring workload should therefore be considered in future studies of physician workload, burnout, and patient satisfaction, as a way to achieve a richer understanding of the actual workload experienced by physicians.
Another important finding of this study is the association between percentile rank with rating of anesthesia services and season of year. Although season of year was not significantly correlated with explanations provided by anesthesiologists, its association with overall rating of anesthesia services suggests that seasonal factors may still influence patient perceptions of anesthesia care, potentially through indirect effects such as resident turnover or systemlevel transitions at the start of the academic year. The “July effect” is well described in the literature [20], and despite the nonsignificant correlation, it is reasonable to expect that new residents may have difficulty providing patients with a full explanation of the anesthetic. As a result, patients might rate their satisfaction with the explanations that were provided lower during the first few months of the academic year. Such a theory is supported by at least one prior study [21], which found that patient satisfaction with anesthesia was significantly higher when patients received better pre-operative information about anesthesia. Shaterian et al. [22] also found that understandable medical explanations were significantly associated with greater overall patient satisfaction. These findings suggest that an emphasis on teaching new anesthesia residents how to communicate with patients and better explain the details of the anesthetic could improve patient satisfaction scores. Future studies assessing resident competency in explaining anesthetic plans are warranted to confirm these trends. Strategies to enhance resident communication with patients include standardizing preoperative explanations, incorporating checklists and teach-back methods, and implementing simulation sessions that allow residents to role-play common preoperative conversations.
The finding that percentile rank on all three satisfaction questions was higher with increasing number of comparator healthcare institutions is also important because it points to the problem of accurately measuring patient satisfaction. While Press Ganey surveys have been found to reliably assess patient satisfaction, high ceiling effects can disproportionately influence average scores in small samples [10]. The reason for the aforementioned association is likely due to a high “ceiling rate” or proportion of patients who give the highest possible response on a survey scale. Several studies [23, 24] of Press Ganey survey questions have demonstrated ceiling rates as high as 70–80%, so it is not surprising that the ceiling rate in our study was more than 70% for all three satisfaction questions. A high ceiling rate (which has been previously defined as ≥ 20%) [10] decreases the ability of a survey question to differentiate levels of satisfaction and can result in significant variation in percentile ranking. It is likely that the association between number of comparator healthcare institutions and the three satisfaction questions in our study were due to the high ceiling rate.
LIMITATIONS
As with all studies, our results should be interpreted within the appropriate context given some important limitations. First, because we studied the workload of attending anesthesiologists, our results may not be entirely applicable to the study of satisfaction associated with residents or certified registered nurse anesthetists. Nevertheless, the findings of our study do appear to be reasonable based on the present data. Second, in our study we used the Press Ganey question “Explanations provided by the anesthesiologists” to measure how well explanations were given to patients; however, Press Ganey also offers a question regarding “Explanation by anesthesia staff.” While the difference in these two questions is very minor (anesthesiologists vs. anes thesia staff), it is unknown whether that subtle difference can have an effect on the observed outcomes. Third, it is important to note that many other surveys (not developed by Press Ganey) measure other aspects of anesthesia care, including postoperative nausea and vomiting [25], pain [26], and pre-operative administration of anxiolytic medication [27]. Therefore, the way that patient satisfaction with anesthesia is measured by Press Ganey does not capture the whole patient experience, and it is possible that the results would be very different if these other aspects of anesthetic care were studied as well. Fourth, the three additional anesthesia questions were designed to briefly explore patients’ anesthesia experience without overburdening the responders, who were already filling out over 30 questions in the HCAHPS survey. The succinct nature of the questions aimed to minimize ceiling rates, though the full perioperative experience may not have been captured by these questions. Thus, results should be interpreted as reflecting a general impression of anesthesia care. Future work should complement these data with more comprehensive anesthesia-specific questions to capture domains such as pain control, anxiety, and postoperative nausea and vomiting. Fifth, as we performed linear regression without indicator variables for individual seasons, we were only able to determine that overall seasonality, and not which specific season, was associated with patient satisfaction. Finally, anesthesiologist workload likely reflects overall operating room busyness, which could influence general, rather than anesthesia-specific, patient experiences with care. Our metric of cases per attending per weekday could not fully distinguish anesthesiaspecific strain from broader system-level effects. Future studies should incorporate additional variables, such as average turnover time and procedure delays, to better isolate the impact of anesthesiologist workload on patient satisfaction.
CONCLUSIONS
We found that percentile rank on anesthesiaspecific questions from the Press Ganey survey at our institution were associated with attending anesthesiologist workload, season of year, and number of comparator healthcare institutions.
The findings can be used to improve patient satisfaction by addressing workload, burnout, and greater supervision when new residents begin. Although currently there are no federal mandates to link payments with patient satisfaction results, working to improve patient satisfaction is important to the American Society of Anesthesiologists Committee on Performance and Outcomes Measurement Patient Satisfaction workgroup, who have suggested that incentives based on patient satisfaction scores should be used to improve anesthesia quality [28]. The Anesthesia Quality Institute has already created a metric, AQI48 “Patient-Reported Experience with Anesthesia,” which is ready to be used for reimbursement through the Medicare Access and CHIP Reauthorization Act of 2015 if it were to become mandatory. While individual physicians can control many factors that contribute to patient satisfaction, there remain variables such as stafng models and national comparator pools that largely require departmentalor system-level action. If payment models linked to patient satisfaction are instituted, our findings suggest that anesthesia-specific scores should be risk-adjusted for contextual factors such as seasonality, workload, and number of comparator institutions before being tied to payment. Furthermore, system-level metrics such as turnover time and on-time starts should also be considered when assessing patient satisfaction.